Create a Monitoring MetricSet with a custom dimension 🔗
Create Monitoring MetricSets (MMS) with custom dimensions to monitor your services in real time. Splunk APM provides a default set of MMS, but you can configure additional MMS using indexed span tags to create custom dimensions. Use your custom MMS to create custom charts, dashboards, and detectors to track what matters most to your team. See Set up charts, dashboards, and alerts for custom dimensions.
What are MetricSets? 🔗
MetricSets are metric time series (MTS) you can use to track the performance of specific metrics over time. To help you analyze your service performance, APM provides 2 categories of MetricSets: Troubleshooting MetricSets (TMS) and Monitoring MetricSets (MMS). Use Troubleshooting MetricSets for high-cardinality troubleshooting. Use Monitoring MetricSets for real-time monitoring and alerting.
APM provides a collection of MetricSets by default. You can also index additional span tags or processes to create additional TMS and, as part of the indexing process, you can opt to create custom dimensionalized Monitoring MetricSets (MMS). See Learn about MetricSets in APM for an overview of the types of MetricSets in APM and a list of the MetricSets available by default.
Use this topic to learn how to index a span tag or process to create Monitoring MetricSets. See Index span tags to create Troubleshooting MetricSets to learn how to create Troubleshooting MetricSets.
Prerequisites 🔗
To create a custom MMS, you must have an admin role.
To create a custom MMS, you need to index the span tag or process that you want to base your MMS on. See Index span tags to create Troubleshooting MetricSets.
If you are unfamiliar with MetricSets, see Learn about MetricSets in APM.
(Optional) Review Metadata: Dimensions, custom properties, tags, and attributes for an overview of the concepts underpinning MetricSets.
Use custom Monitoring MetricSets to monitor important metrics 🔗
In addition to the MMS APM creates by default, you can create additional MMS with custom dimensions to filter and aggregate the default created metrics by a specific indexed span tag or process such as version or cloud.provider.
You can create custom MMS at the service level and the endpoint or span level. When you create a custom dimension for a service-level MMS, APM creates an MMS that includes the service-level metrics with your chosen indexed span tag or process as a custom dimension. If you add endpoint-level metrics, APM creates MMS that include span-level metrics, with your chosen indexed span tag or process as a custom dimension.
When you create an MMS with a custom dimension, you can use the custom dimension to create charts, dashboards, and alerts. See Set up charts, dashboards, and alerts for custom dimensions.
To learn more about a specific scenario for custom MMS: Scenario: Kai monitors detector service latency for a group of customers.
Create a Monitoring MetricSet with a custom dimension for an instrumented service 🔗
Before you create an MMS, first consider:
How you want to allocate the cardinality of your data to make your MMS most efficient.
Your organization’s cardinality limits. See Troubleshoot cardinality in Monitoring MetricSets for guidance on editing your MetricSet configuration to optimize your overall cardinality.
Select how you want to configure your Monitoring MetricSet 🔗
You can create a Monitoring MetricSet in 3 ways:
service-level MMS only
endpoint-level MMS for specific endpoints within a given service
orient both service-level MMS and endpoint-level MMS for all endpoints within a service
Select the best option for your needs to allocate your organization’s cardinality entitlement efficiently. See Configure your MMS to be more efficient to learn more.
You can also filter by specific tag values to further reduce the cardinality of your MMS.
Option |
Guidance |
|---|---|
service-level MMS and endpoint-level MMS for all endpoints within a service |
This option creates a custom dimensionalized MMS for each selected service, as well as an MMS for each endpoint in each selected service. This is the highest cardinality option. |
service-level MMS and endpoint-level MMS for specific endpoints |
This option creates a custom dimensionalized MMS for each selected service and an MMS for specific endpoints you select. In the box labeled Endpoint Filters, provide a list of endpoints or a regular expression pattern to create MMS for specific endpoints you’re interested in. This helps you to minimize unnecessary cardinality. |
Service-level MMS only |
This option creates an MMS for each selected service and no endpoint-level MMS. This is the lowest cardinality option. |
Scope of Monitoring MetricsSets 🔗
You can create custom MMS for endpoints (metrics starting with span*) and services (metrics starting with service.request.*), but not for workflows (metrics starting with workflow*) or traces (metrics starting with trace*) at this time. Custom MMS aren’t supported for global tags. See Available default MMS metrics and dimensions.
Add a Monitoring MetricSet 🔗
Follow these steps to create a Monitoring MetricSet for an instrumented service:
To get to the APM MetricSets page, do one of the following:
In Splunk APM, select APM Configuration and select APM MetricSets from the menu. The APM MetricSets page opens.
From anywhere in Splunk Observability Cloud, select Settings in the navigation bar and select APM MetricSets under Data Configuration.
On the APM MetricSets page, you have 2 options:
If you have already indexed the span tag or process, it appears in the list of MetricSets and is already generating Troubleshooting MetricSets. Select the edit icon for that span tag to open the Edit MetricSet dialog box and add a Monitoring MetricSet to your configuration using the following steps.
If you haven’t already indexed the tag or process, select New MetricSet. Enter the Name of a span tag or process you want to index. Then continue with the following steps.
The Scope determines how APM associates the span tag or process with services in a trace. Enter the service or services for which you want to create a Monitoring MetricSet in the Service field. You can only create custom dimensionalized MMS for service-level indexed span tags. You can’t create custom MMS for globally indexed span tags.
In the Add MetricSet or Edit MetricSet dialog box, select the check box for Also Create Monitoring MetricSet.
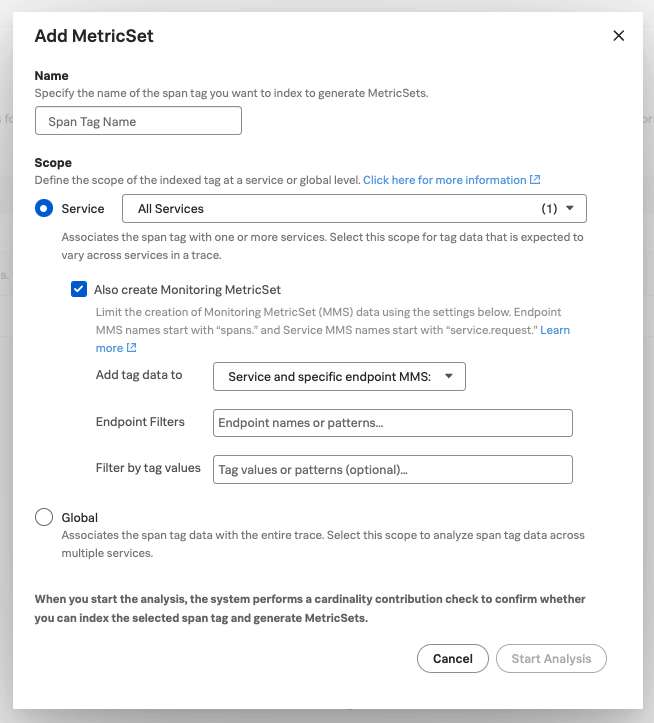
- Select how you want to add tag or process data to your Monitoring MetricSet from the dropdown. See Select how you want to configure your Monitoring MetricSet for more details.
Service and all endpoint MMS: Create an MMS for each selected service, as well as an MMS for each endpoint in each selected service.
Service and specific endpoint MMS: Create an MMS for each selected service and an MMS for specific endpoints you select. To add Endpoint Filters, provide a list of endpoints or a regular expression pattern to create MMS for specific endpoints you’re interested in.
Service MMS only: Create an MMS for each selected service and no endpoint-level MMS.
(Optional) In the field labeled Filter by tag values, add tag filters to narrow the scope of your MMS to include only data associated with the tag values you enter. This can help further reduce cardinality in your MetricSets.
Select Start Analysis to submit the configuration. Splunk APM runs an analysis of the span tag or process to calculate the potential cardinality contribution of the MetricSet to determine whether it is within your entitlement limit.
Your new MetricSet shows under Pending MetricSets section of the table with an Analyzing status while the cardinality check runs. You might have to wait a few moments for the check to run.
Caution
Your pending MetricSet expires after 1 hour. If your MetricSet times out before you activate it, run the analysis again.
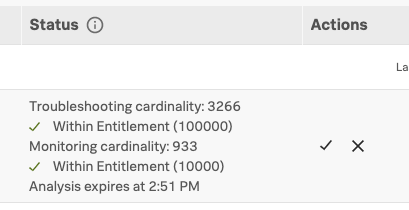
After the cardinality check has run, review the cardinality and activate your new MetricSet.
If the cardinality impact of indexing this new MetricSet is within your subscription limit you see a green check mark and “Within Entitlement.” Select the check mark under Actions to activate your Monitoring MetricSet.
If the check times out before you activate the MetricSet, run the analysis again.
If the check shows as failed, your cardinality is over your subscription limit for MMS or is otherwise invalid. See Cardinality contribution of indexed span tags and processes. For steps to configure your MetricSet to be more efficient or other troubleshooting solutions, see Troubleshoot cardinality in Monitoring MetricSets.
The following example shows a cardinality check.
Note
For standard MMS Splunk APM replaces dots with underscores in dimension names for MMS time series. For histogram MMS underscores are preserved.
Create a Monitoring MetricSet with a custom dimension for an inferred service 🔗
Note
Only 3rd-party or uninstrumented HTTP services are supported for MMS.
Follow these steps to create a Monitoring MetricSet for an inferred service:
To get to the APM MetricSets page, do one of the following:
In Splunk APM, select APM Configuration and select APM MetricSets from the menu. The APM MetricSets page opens.
From anywhere in Splunk Observability Cloud, select Settings in the navigation bar and select APM MetricSets under Data Configuration.
On the APM MetricSets page, scroll to the Inferred Service Monitoring MetricSets section and select Add Inferred Service MMS.
Select the inferred service for which you want to create a Monitoring MetricSet.
Select Save.
Your new MetricSet shows under Pending MetricSets section of the table with an Analyzing status while the cardinality check runs. You might have to wait a few moments for the check to run.
Caution
Your pending MetricSet expires after 1 hour. If your MetricSet times out before you activate it, run the analysis again.
After the cardinality check has run, review the cardinality and activate your new MetricSet.
If the cardinality impact of indexing this new MetricSet is within your subscription limit you see a green check mark and “Within Entitlement.” Select the check mark under Actions to activate your Monitoring MetricSet.
If the check times out before you activate the MetricSet, run the analysis again.
If the check shows as failed, your cardinality is over your subscription limit for MMS or is otherwise invalid. See Cardinality contribution of indexed span tags and processes.
Set up charts, dashboards, and alerts for custom dimensions 🔗
You can create charts, dashboards, and alerts based on your custom Monitoring MetricSet.
To use the custom dimensionalized Monitoring MetricSets you have created, apply the filter sf_dimensionalized:true. This filters out the metrics created by the default Monitoring MetricSet. To filter your metrics even more, use the new dimension you have created which is the tag name you indexed.
Task |
Documentation |
|---|---|
Create charts |
|
Create dashboards |
|
Create an alert |
|
Monitor services in APM dashboards |
Metrics and dimensions of Monitoring MetricSets 🔗
Each MMS has a set of metrics and dimensions for spans and traces you can use to monitor and alert on service performance.
To prevent over counting metrics in aggregations, the built-in dashboards and charts in Splunk APM automatically exclude custom dimensionalized MMS.
Custom dimensionalized MMS have a marker dimension, sf_dimensionalized: true, to include custom dimensionalized MMS.
When you create your dashboards and charts, you can exclude custom dimensionalized MMS by adding a filter on !sf_dimensionalized: true.
If you want to look at the time series of a custom dimensionalized MMS in your charts, filter on sf_dimensionalized: true and then aggregate by the custom dimension you want to look at.