Part 3: View your data in Splunk APM 🔗
Before you can view data in Splunk Application Performance Monitoring (APM), make sure that the application is active and generating data. Send requests to the application through cURL or interact with the application’s UI to generate activity.
Follow these steps to start viewing your data:
Navigate to the Splunk Observability Cloud home page.
Select APM.
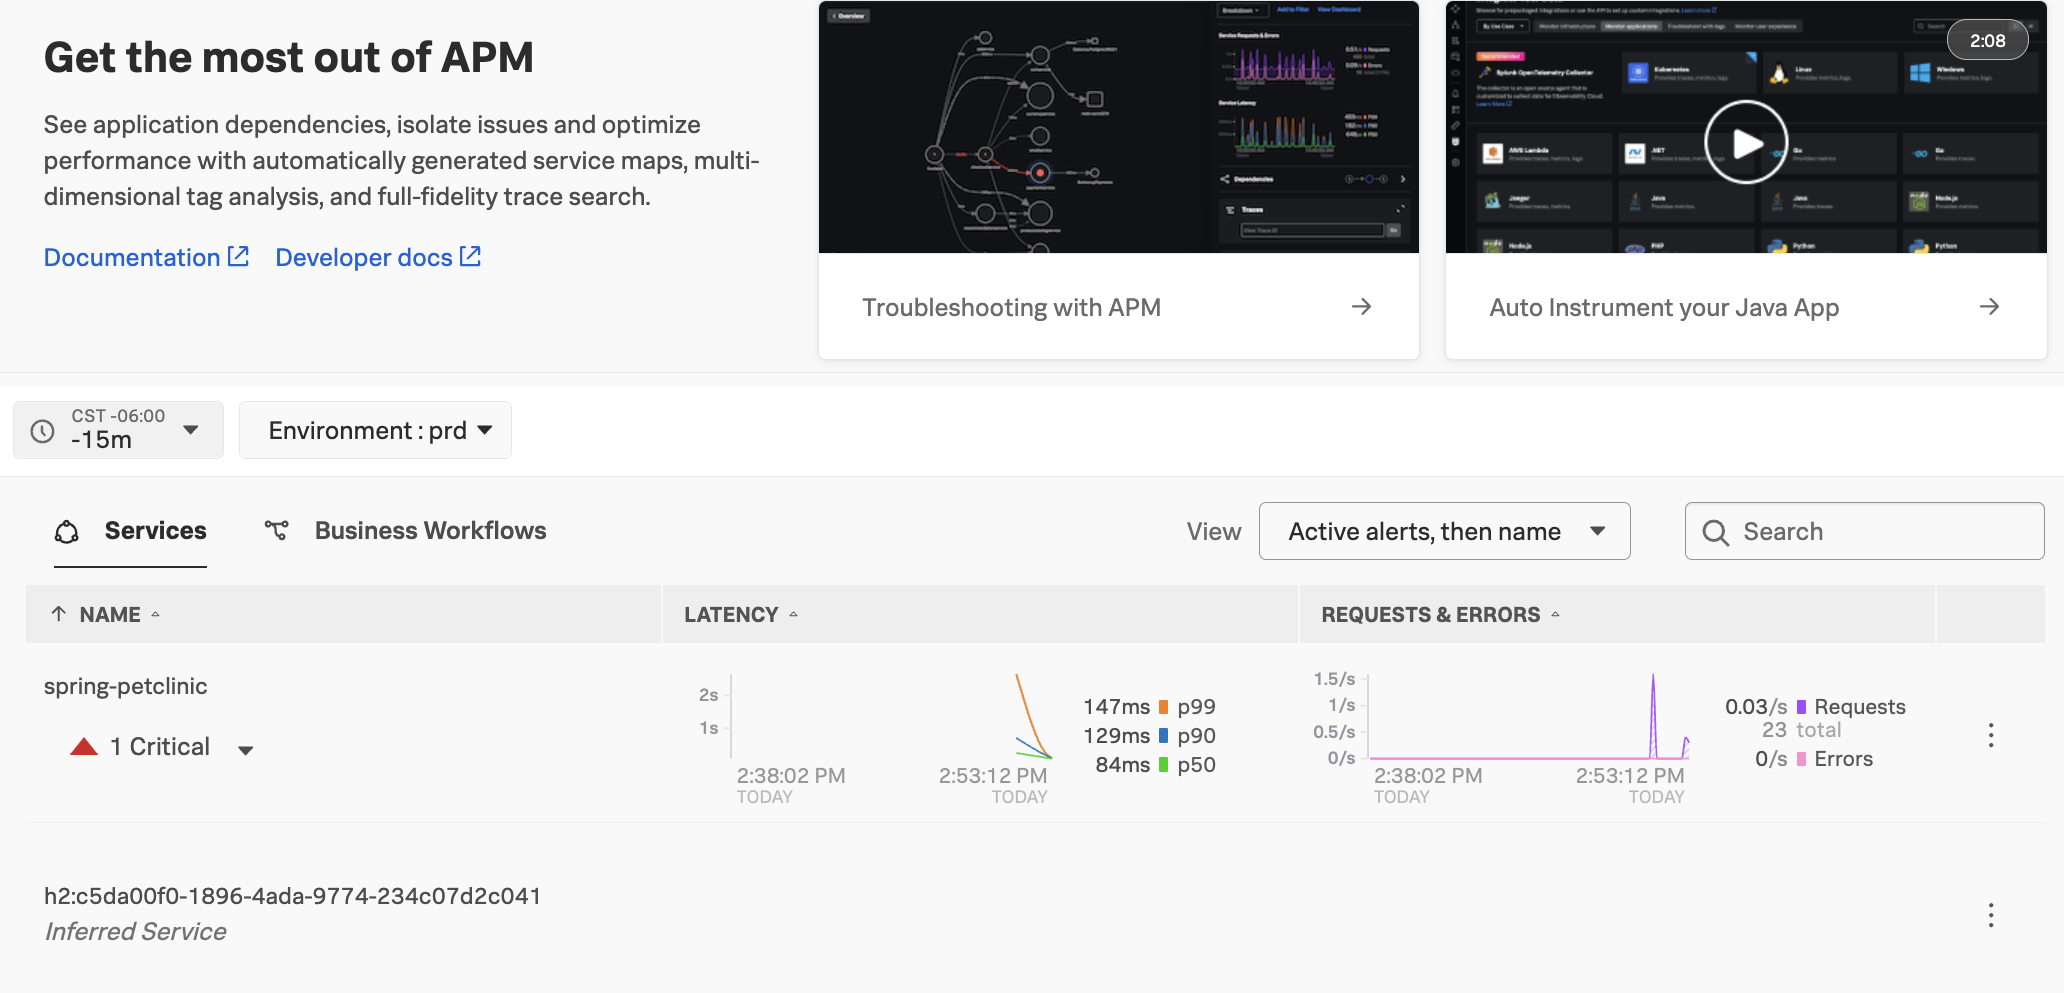
Search for your service by using the Environment filter or by entering your service name in the search bar. It might take a few minutes for your service to appear in APM.
The spring-petclinic service appears in the results:

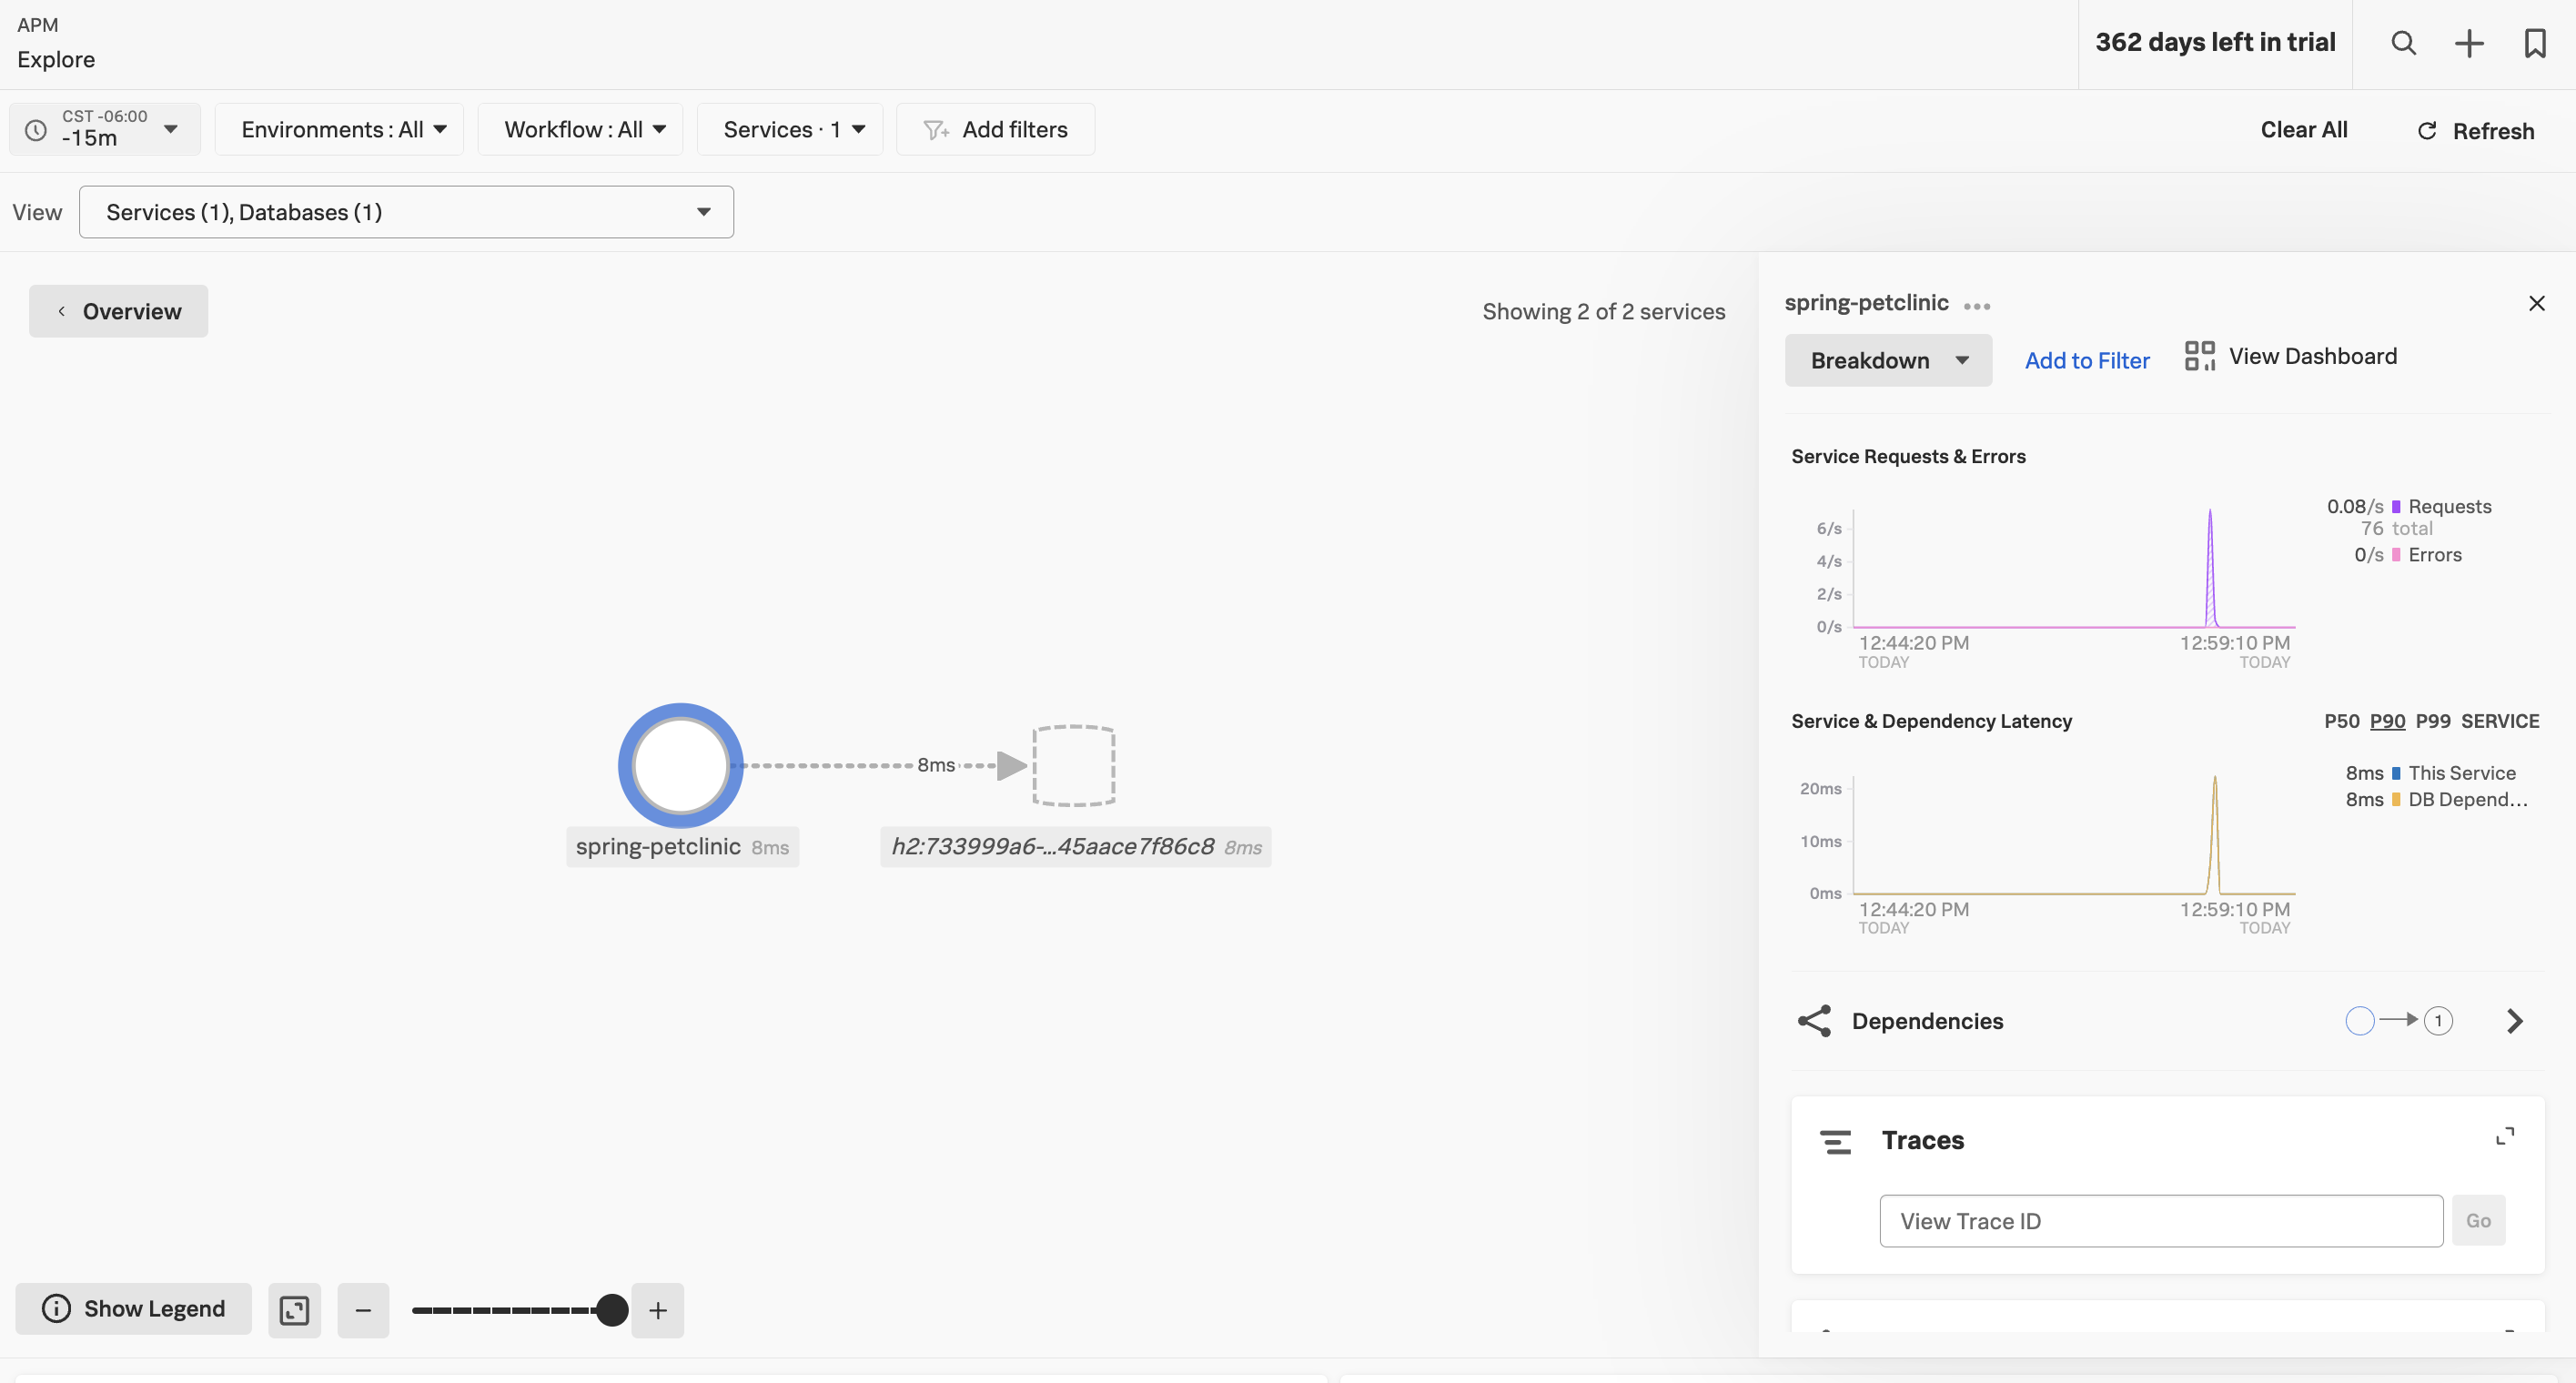
Next, select the service. A page with detailed APM data opens:

You’ve now successfully deployed and instrumented a Java application in Kubernetes, and you can now see your data in Splunk APM.
See the Learn more section for additional resources about Splunk APM and Splunk automatic discovery and configuration.
Learn more 🔗
See Introduction to Splunk APM to learn how to use Splunk APM to gather insights about your data.
See Automatic discovery of apps and services for more information about automatic discovery and automatic instrumentation.