Introduction to Network Explorer 🔗
As part of your existing Splunk Infrastructure Monitoring experience, Network Explorer is a network observability capability designed for cloud and micro-service environments.
Network Explorer lets you ingest and analyze network telemetry, which you can use to:
Identify network anomalies in real time.
Discover sources of high network cost in your environment.
Examine service topology with visualizations.
How does Network Explorer work? 🔗
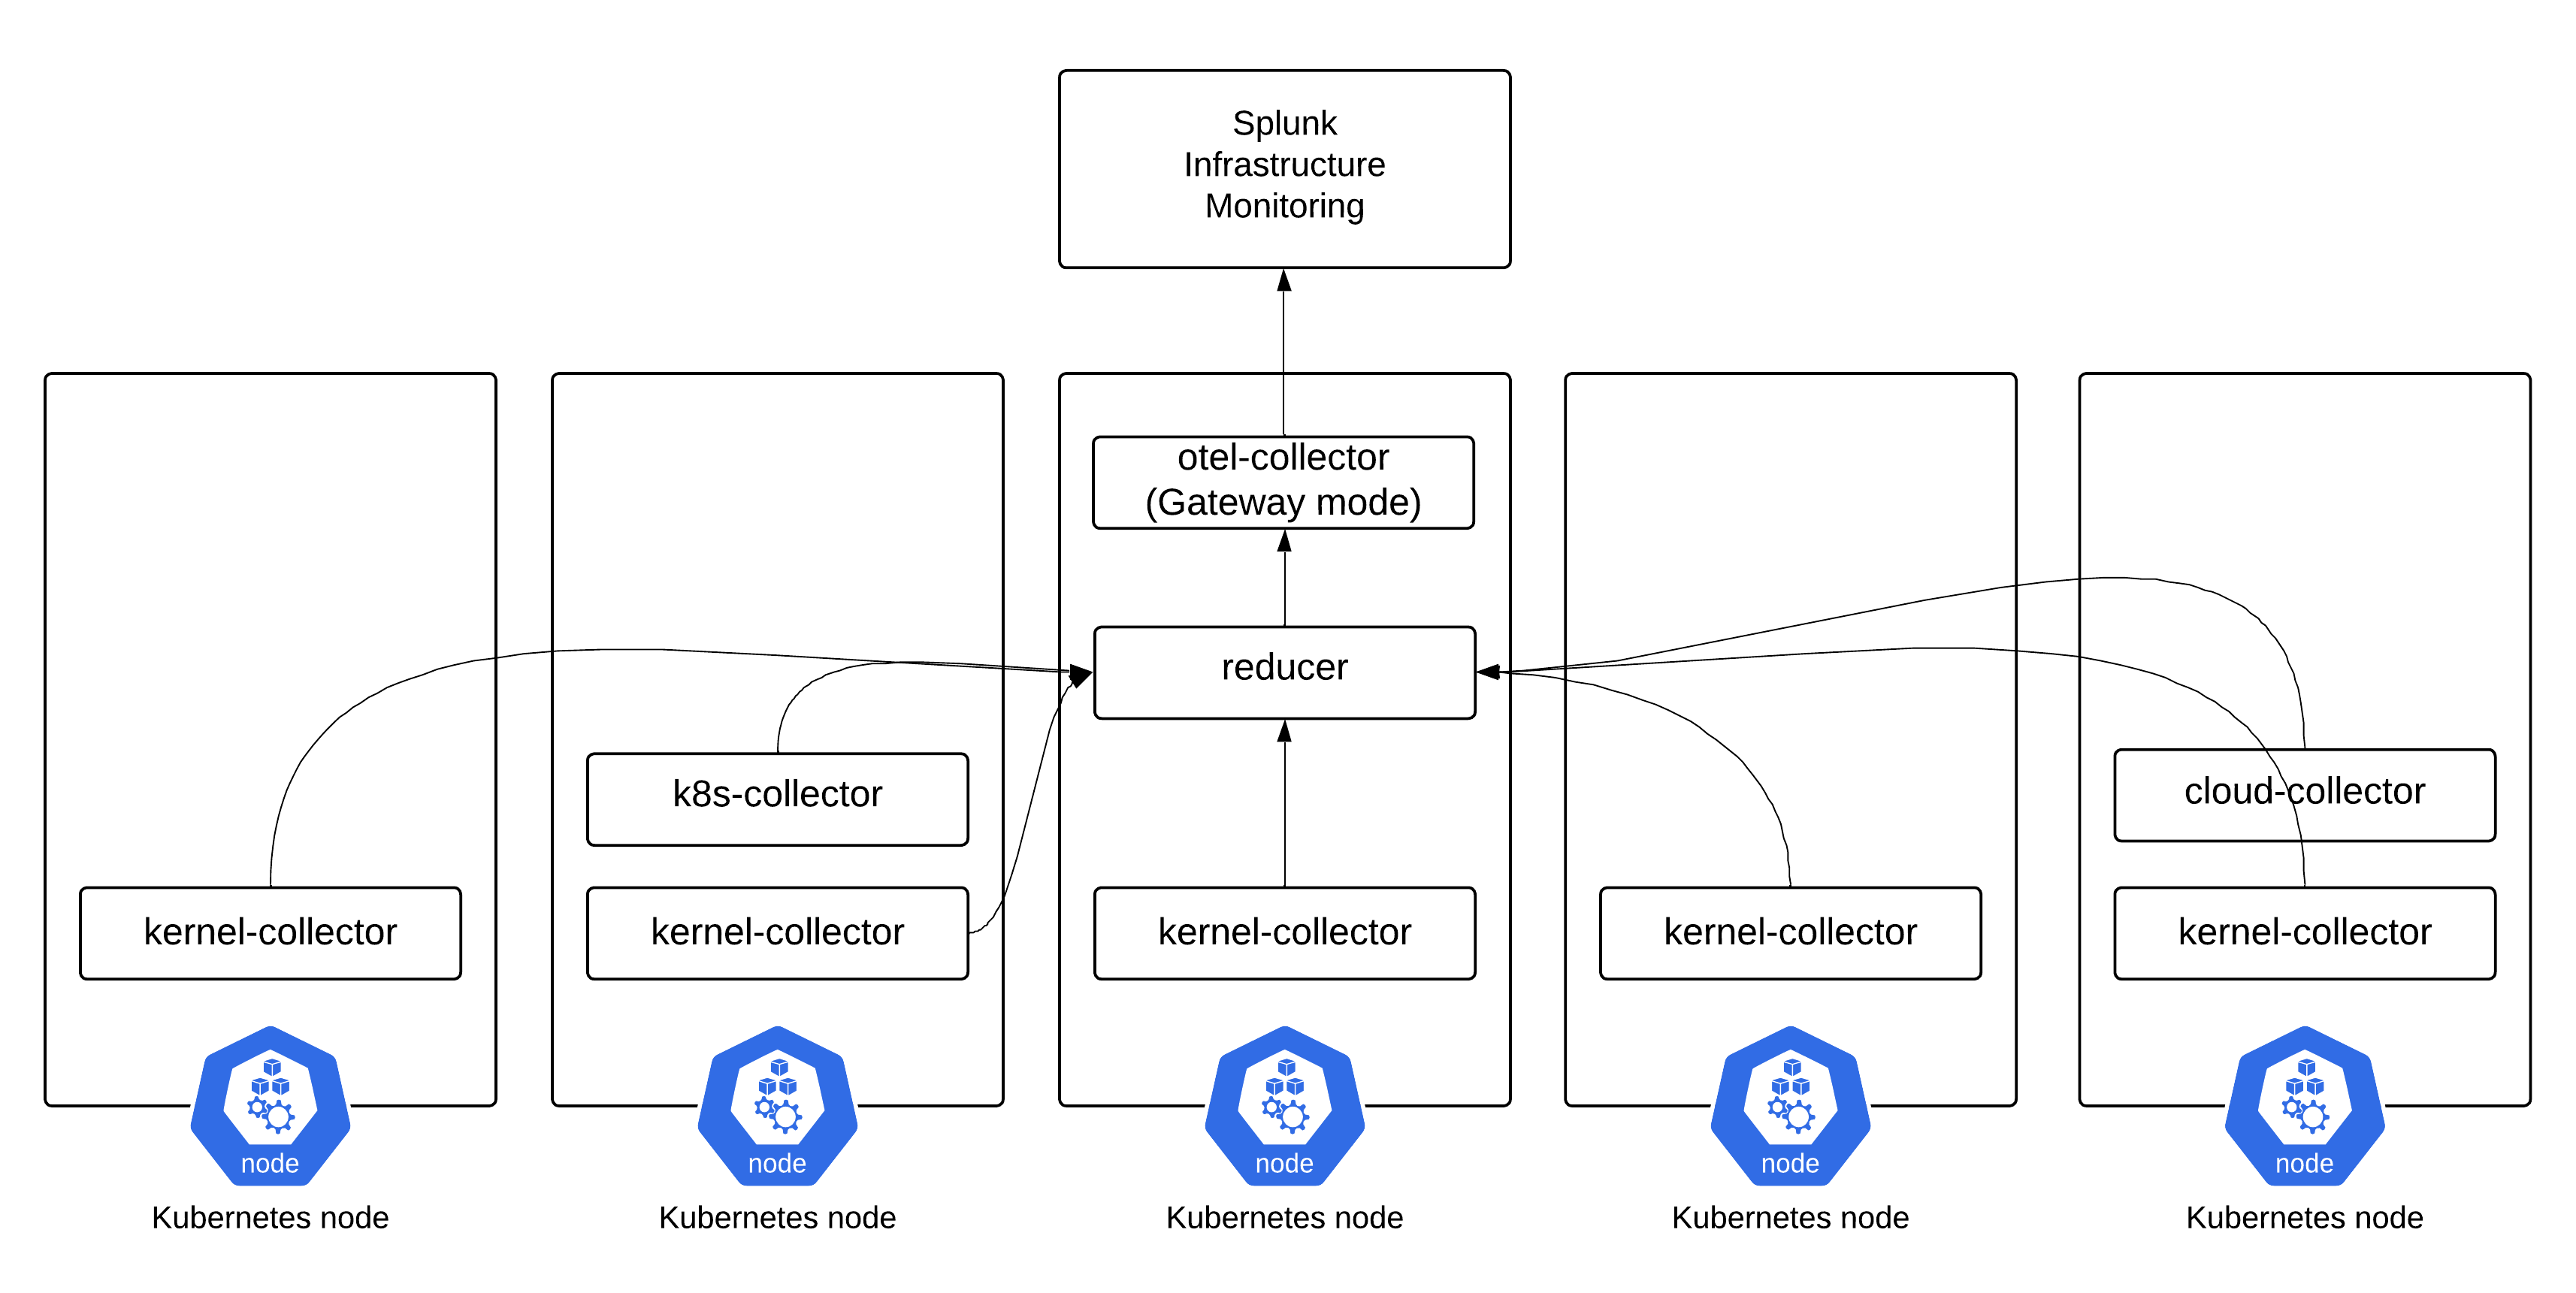
Network Explorer uses kernel collectors to collect network data on your hosts and send the collected data to the Splunk Distribution of OpenTelemetry Collector through a centralized reducer. The Splunk Distribution of OpenTelemetry Collector then sends your network data to Splunk Infrastructure Monitoring, giving you visibility into your network topology and errors.
Get started with Network Explorer 🔗
For information on how to set up Network Explorer, see Set up Network Explorer in Kubernetes.
Note
While Splunk Observability Cloud fully supports the Network Explorer navigator, the upstream OpenTelemetry eBPF Helm chart is not covered under official Splunk support. Any feature updates, security, or bug fixes to it are not bound by any SLAs.
If you wish to continue using Network Explorer to see data in Splunk Observability Cloud, point the upstream eBPF Helm chart to the OpenTelemetry Collector running as a gateway.