Analyze your metric usage in Splunk Observability Cloud 🔗
Usage analytics gives you in-depth visualizations of your metric usage in Splunk Observability Cloud. Usage analytics can help you make informed decisions about your metrics, for example, if you’re deciding whether to aggregate, archive, or drop certain metrics.
To learn how to use usage analytics, see View and understand your metric usage.
For guidance in using usage analytics to manage and reduce your overall metric usage, see Manage and reduce your metric usage.
To learn more about metric usage and billing, see Monitor and manage subscription usage and billing.
Benefits of usage analytics 🔗
With usage analytics, you can quickly find and visualize which metrics your organization is using and how these metrics contribute to your overall monthly usage. With this information, you can accurately decide how to manage individual metrics for the purpose of reducing your overall usage.
Usage analytics can help you complete the following example scenarios:
You want to view high-cardinality custom metrics that are taking up large chunks of your metric usage plan.
You want to identify what metrics your team is producing so you can assess their usefulness.
You want to find the source and ownership of a certain metric so that you can modify or adjust it.
View and understand your metric usage 🔗
Usage analytics displays several charts and visualizations that help you determine your metric usage relative to your usage plan.
With usage analytics, you can also find more details about individual metrics, such as which dimensions the metric uses, which tokens the metric is associated with, and which charts the metric appears in.
Access usage analytics 🔗
To access usage analytics in Splunk Observability Cloud, follow these steps:
In Splunk Observability Cloud, select Settings.
Under Data Configuration, select Metrics Management.
Select the Usage analytics tab.
Caution
The following message displays if you’ve sent too many queries in a short time period. If you see this message, reload the page after 2 minutes.

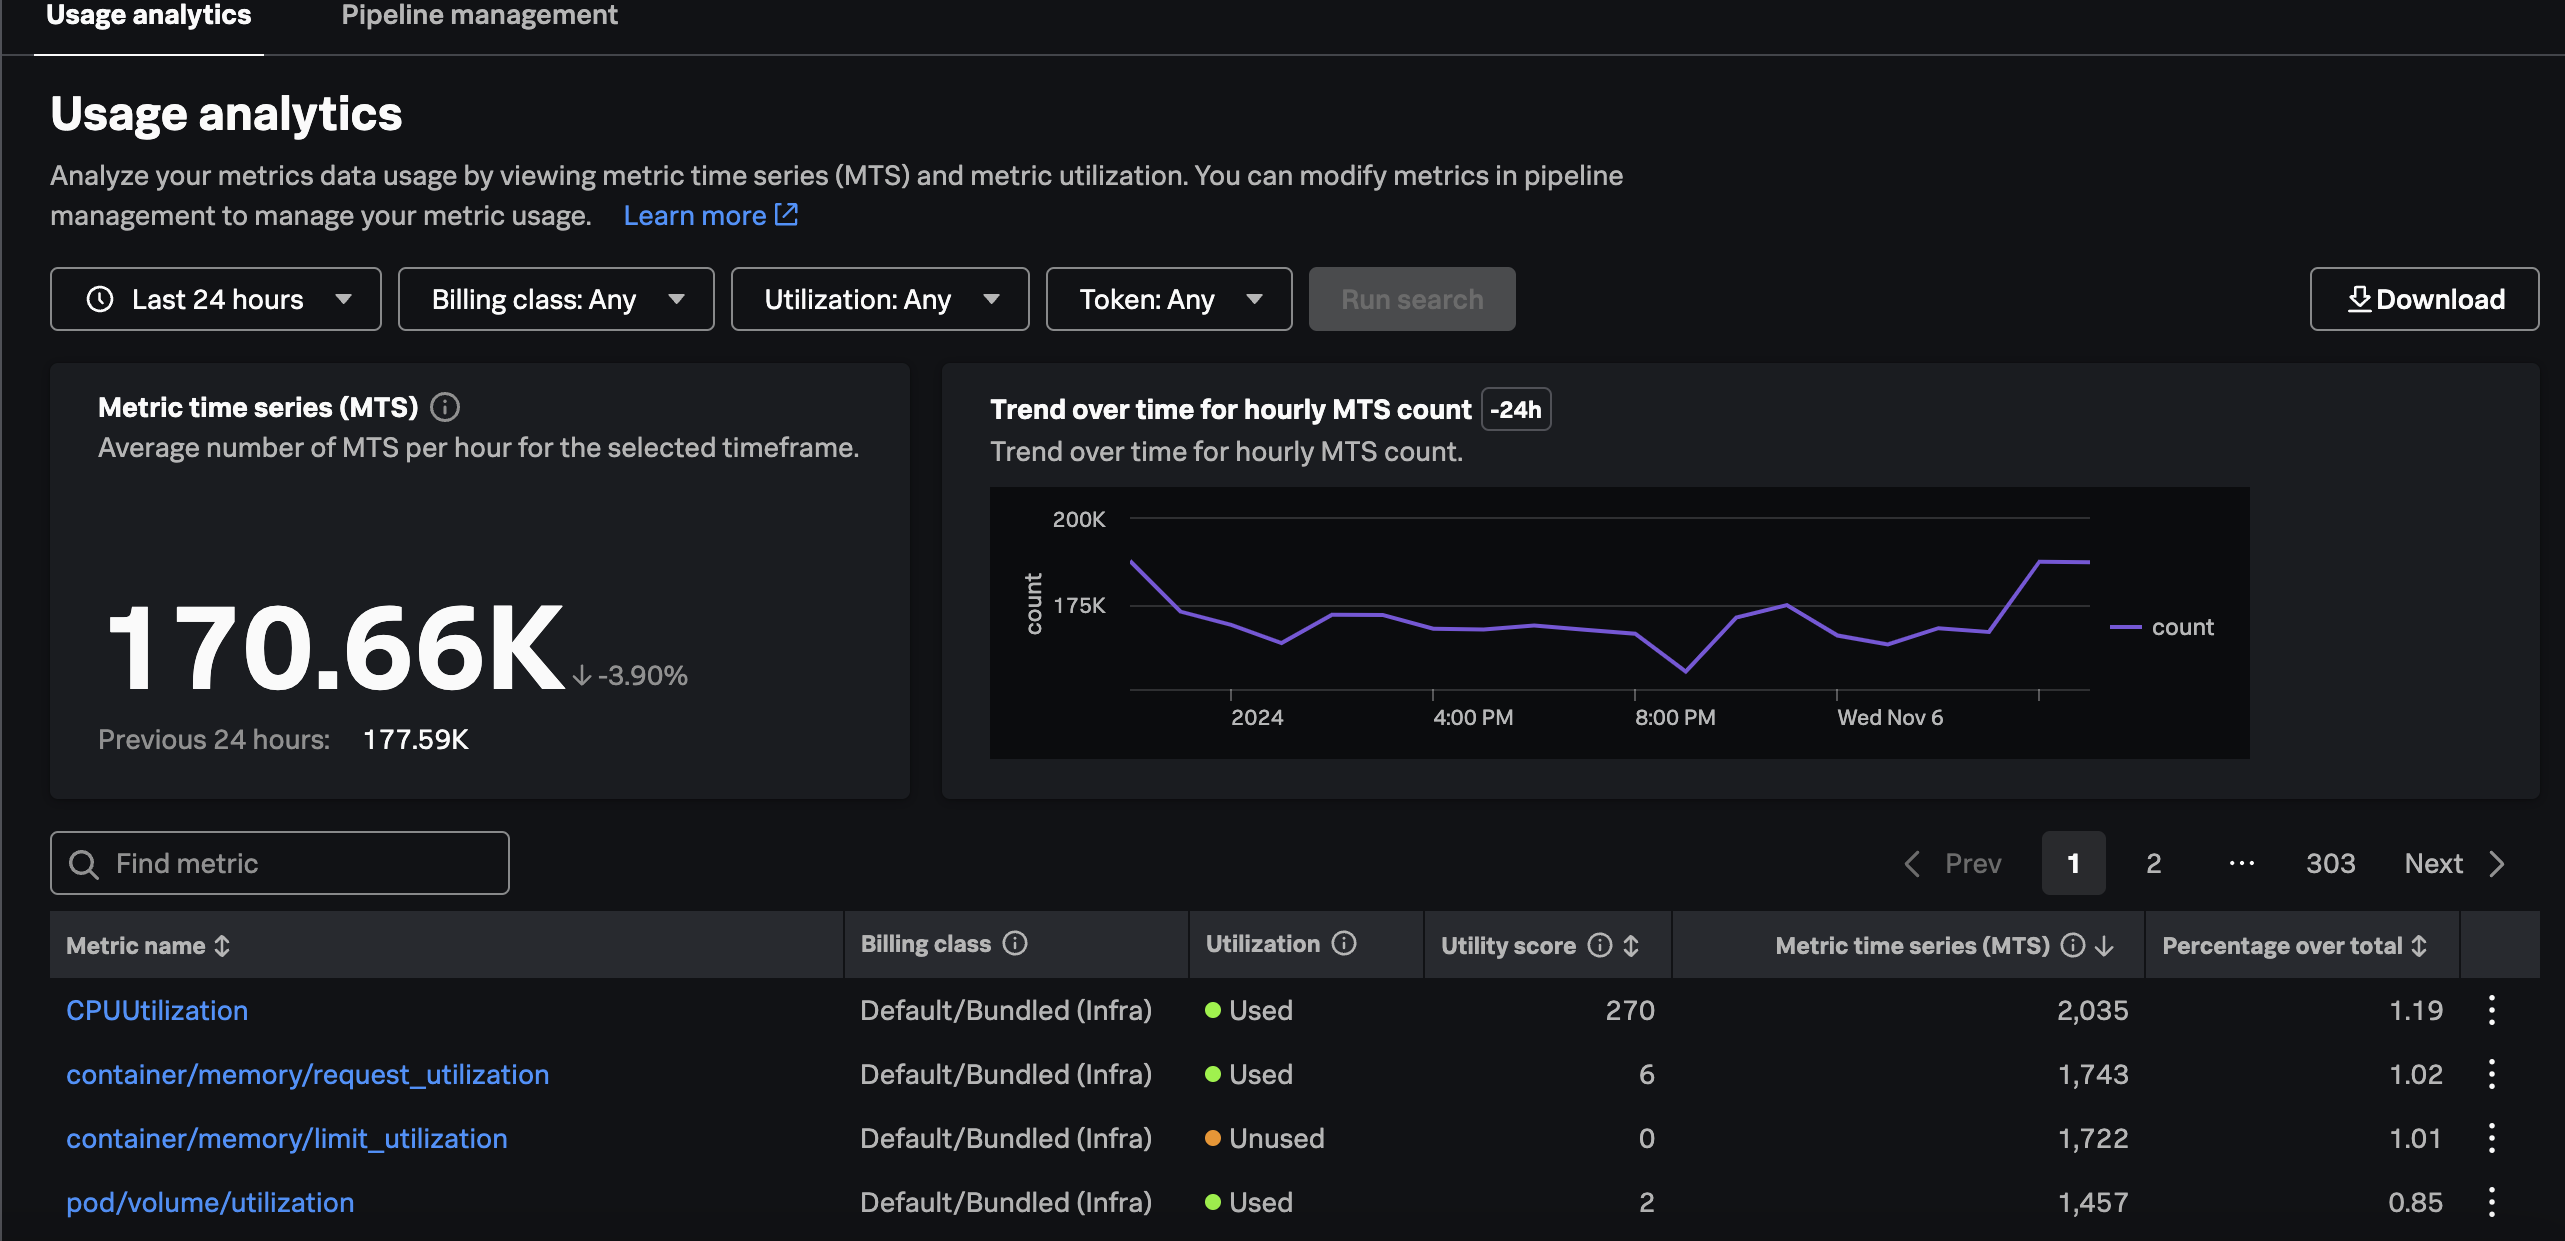
The usage analytics home page contains the following visualizations:
A card displaying the average number of metric time series (MTS) per hour for your selected time frame.
A chart displaying the average number of MTS per half hour over the selected time frame.
The metrics table, displaying each of your metrics and their usage. See Understand metric usage with the metrics table to interpret these values.

Note
Usage analytics doesn’t show APM Monitoring MetricSets, RUM Monitoring MetricSets, or default/bundled APM metrics. To learn more about usage analytics, see Analyze your metric usage in Splunk Observability Cloud.
Understand metric usage with the metrics table 🔗
The metric usage table displays the following fields:
Field |
Description |
|---|---|
Metric name |
The name of the metric. |
Billing class |
Class of metric for billing purposes (host, billing, or custom). Usage analytics doesn’t show APM Monitoring MetricSets or RUM Monitoring MetricSets. To learn more about billing classes, see Metric categories. |
Utilization |
Whether the metric is used. “Unused” indicates that the metric is producing MTS, but these values aren’t utilized in Splunk Observability Cloud. |
Utility score |
Indicates how much the metric is used. A high utility score means higher usage. |
Metric time series (MTS) |
The average number of MTS associated with this metric, measured per hour. |
Percentage of total |
How much of your total usage plan this metric utilizes. |
You can use the options at the top of the page to filter metrics by time, billing class, utilization, and token.
For example, if you only want to see metrics that are unused, follow these steps:
Select the box with Utilization: Any.
In the menu, select Unused.
Select Run search.
After running the search, the usage analytics page displays only metrics which are unused. To revert the search, select Reset.
Note
Running searches with filters that yield more results, such as searching for metrics from the previous 30 days instead of the previous 24 hours, might cause the search to run slower.
View dimensions, tokens, and charts with metric profiles 🔗
Usage analytics includes metric profiles for each of your metrics. To access a metric profile, select one of the metrics in your metric usage table.
Metric profiles provide the following tables with additional information about the metric:
Table |
Description |
Notes |
|---|---|---|
Dimensions |
Displays the dimension name of each metric sorted by average hourly MTS count. High-cardinality dimensions appear at the top of the list. |
Displays up to 5000 dimensions. |
Tokens |
Displays the token name and ID for each metric, sorted by the number of metric time series associated with the token. |
Displays up to 5000 tokens. |
Charts |
Displays the charts and dashboards associated with each of your metrics, as well as the user who last updated the chart and the time they updated it. |
None |
Detectors |
Displays the detectors associated with each of your metrics, as well as the user who last updated the detector and the time they updated it. |
None |
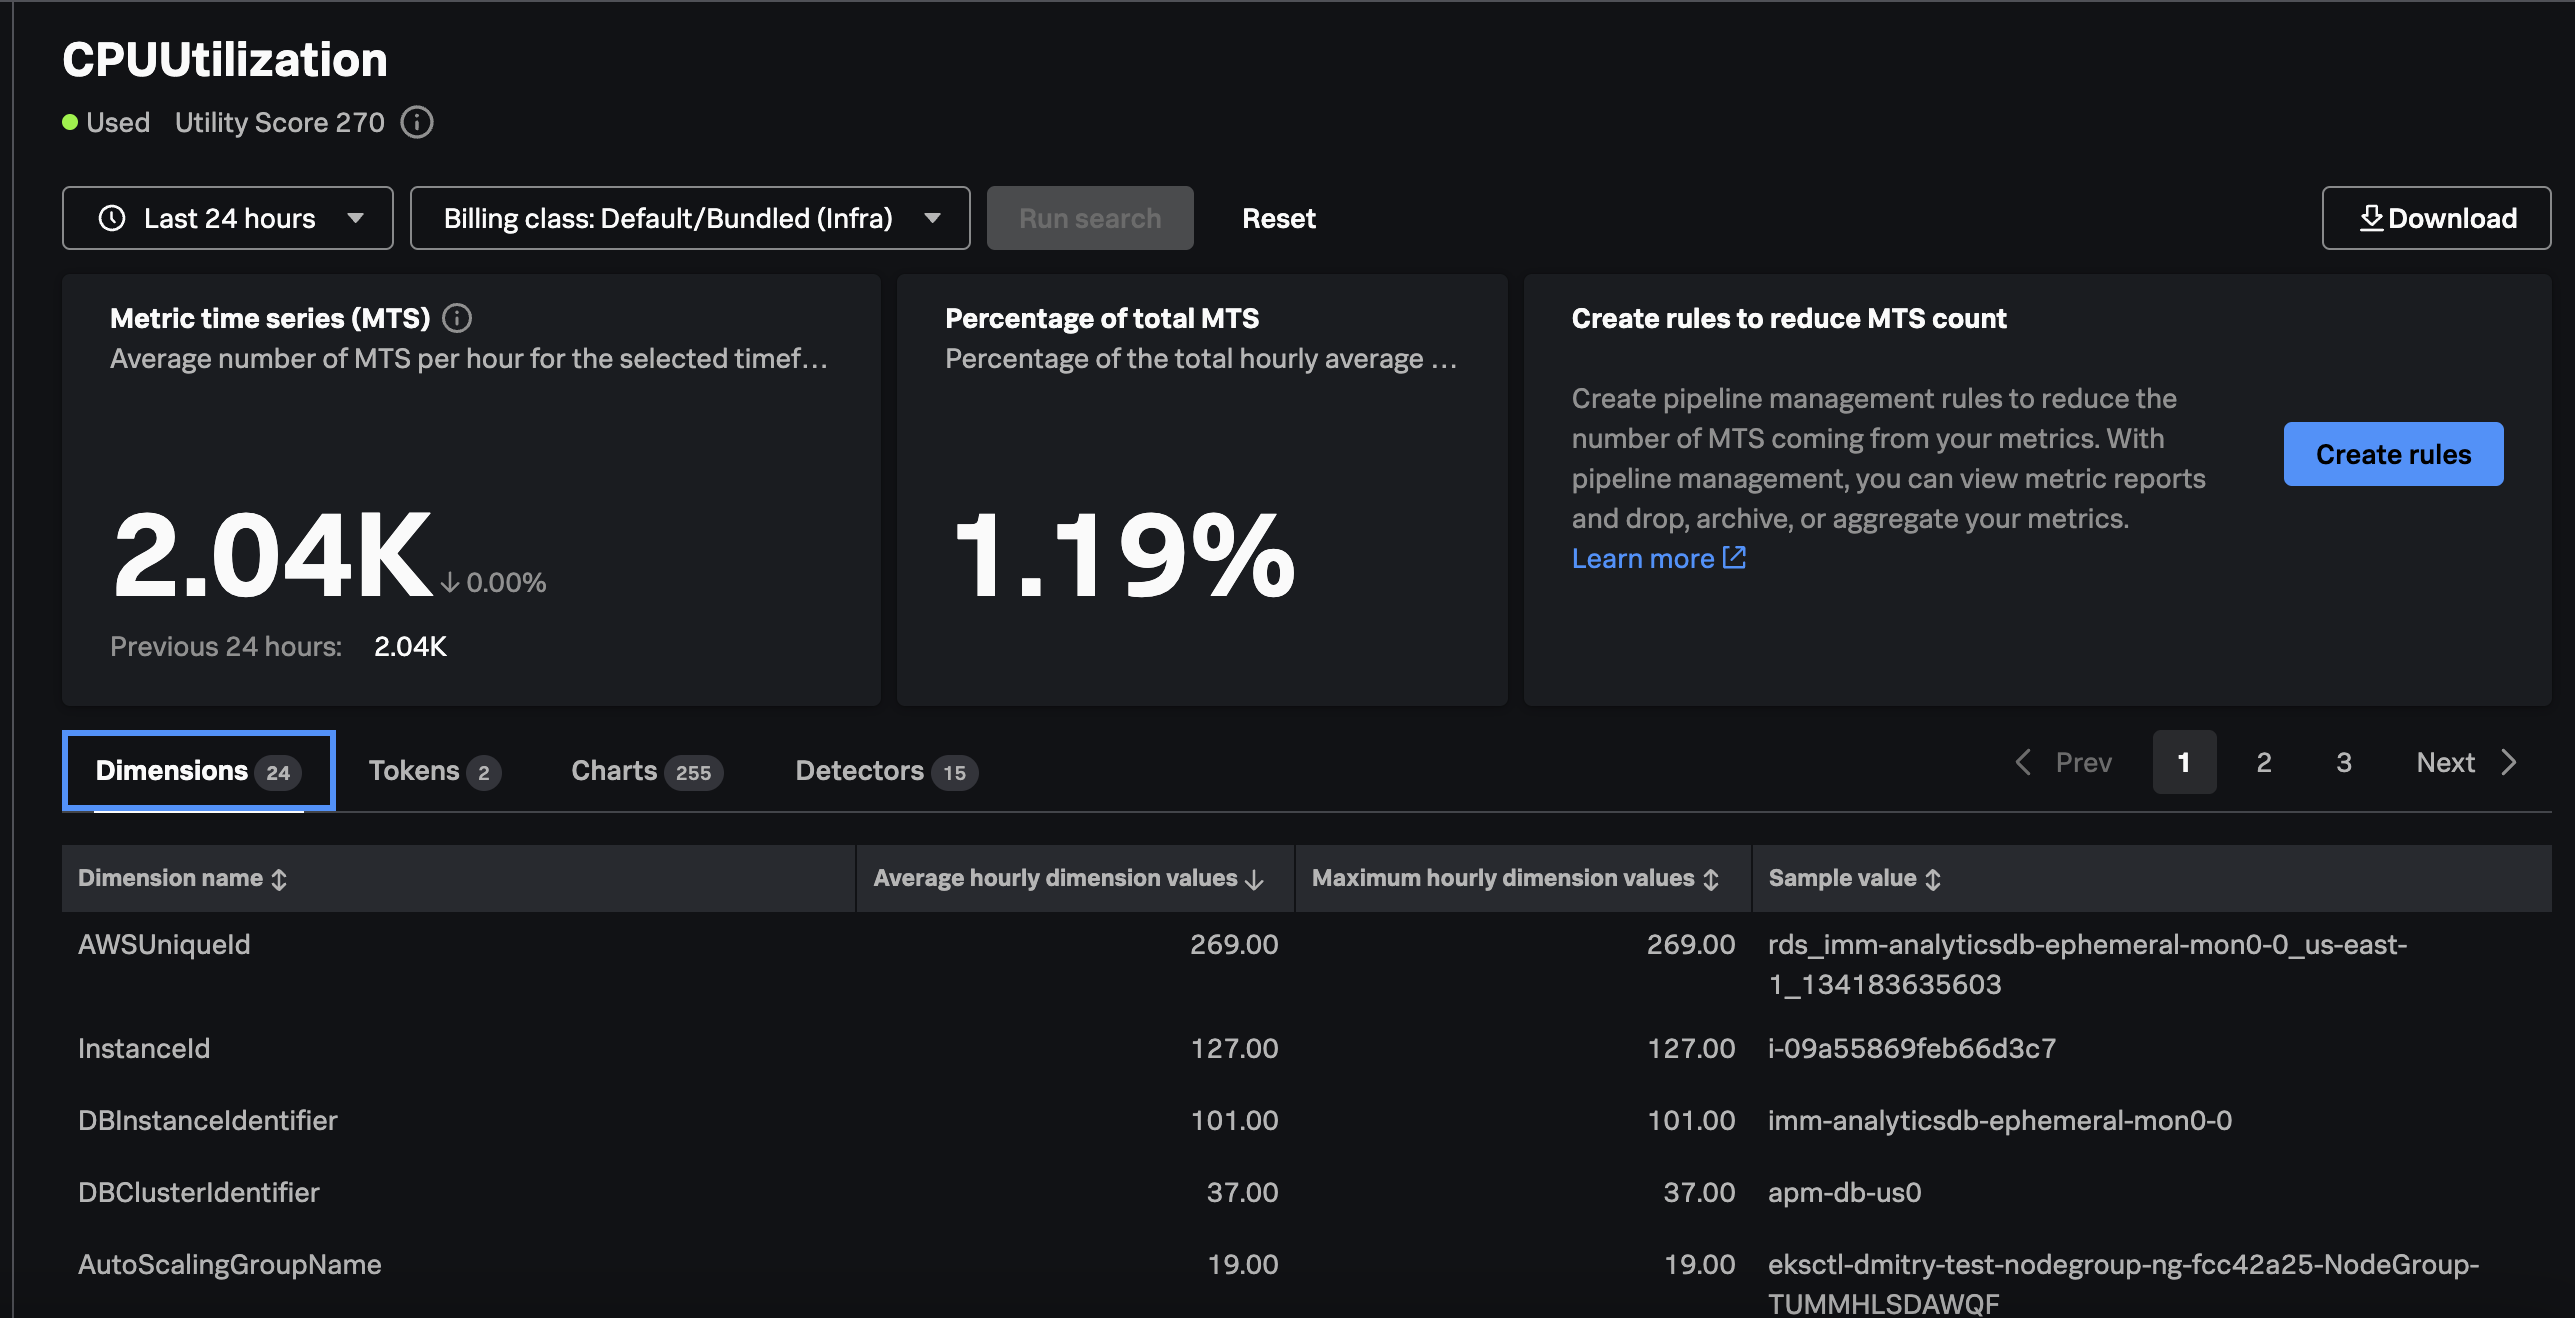
For example, the following metric profile displays information about the CPUUtilization metric, including the metric’s dimensions:

Manage and reduce your metric usage 🔗
This section contains tips for identifying metrics that you can aggregate, archive, or drop for the purpose of reducing your metric usage.
Archive or drop unused metrics 🔗
Using the metrics table, you can find metrics that aren’t used. If you have any unused metrics, you can archive them so they take up less of your usage plan.
Archived metrics go to an archival route in Splunk Observability Cloud, where they remain unused and have a lower billing cost. You can bring them out of the archival route whenever you need to use them again.
To learn more about archiving metrics, see Archived metrics.
If you aren’t using these metrics and don’t plan on using them in the future, consider dropping them to save usage space. To learn more about dropping metrics, see Use data routing to keep, archive, or discard your metrics.
Find metrics with low utility scores and aggregate them 🔗
If you have metrics with low utility scores, consider aggregating them to reduce the total number of metrics.
To help decide whether to aggregate these metrics, follow these steps:
Select the metric you’re considering aggregating to open the metric profile.
Select the Detectors tab to check whether the metric appears in any detectors.
If the metric doesn’t appear in detectors, check the Charts tab to see which charts use it.
Consider whether the metric is important to keep in the respective charts. If not, then aggregate the metric with other dimensions to reduce usage.
To learn more about how to aggregate metrics, see Use aggregation rules to control your data volume.
Reduce the cardinality of your metrics 🔗
If you have metrics with high cardinality, consider using a routing exception rule to reroute specific MTS. For example, you can archive or drop MTS with dimensions that you aren’t using.
To learn more about using routing exception rules, see Use routing exception rules to route a specific MTS or restore archived data.