Splunk® Style Guide

Splunk Style Guide

Acrobat logo Download manual as PDF


The guidelines in the Splunk Style Guide establish best practices for writing technical documentation. Search docs.splunk.com to find documentation related to Splunk products.
Acrobat logo Download topic as PDF

Diagrams

You can use a diagram to help users understand complex system architecture, task flows, processes, and conceptual information. Diagrams supplement your content, so don't replace your writing with a diagram. It's okay if a diagram has text in it.

See the following example of a simple diagram:

This diagram shows a standard two-phase search process. The process is described before the diagram, in the section "Overview of parallel reduce search processing".

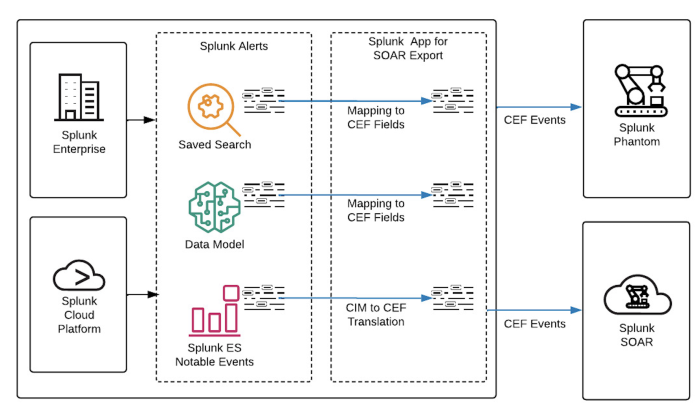
See the following example of a complex diagram:

The Splunk Phantom web interface connects to a load balancer, which connects to three Splunk Phantom cluster nodes. The nodes connect to a PostgreSQL database, a file share, and a Splunk platform deployment.

This complex diagram uses color but doesn't rely on color to convey meaning. The lines use color in combination with different dash lengths so that readers who can't distinguish between colors can follow the path of the lines. A legend is included to identify each type of line.

For general guidelines on including images in Splunk docs, see Best practices for including images.

Last modified on 25 September, 2023
PREVIOUS
Screenshots
  NEXT
GIFs

This documentation applies to the following versions of Splunk® Style Guide: current


Was this documentation topic helpful?


You must be logged into splunk.com in order to post comments. Log in now.

Please try to keep this discussion focused on the content covered in this documentation topic. If you have a more general question about Splunk functionality or are experiencing a difficulty with Splunk, consider posting a question to Splunkbase Answers.

0 out of 1000 Characters