Configure detectors and alerts in Splunk APM 🔗
You can use detectors to dynamically monitor request rate, error rate, and latency in the services you are tracing with Splunk APM. APM detectors use built-in algorithms to generate alerts about sudden spikes, historical anomalies, or a static threshold in your APM metrics or Business Workflows. See Use built-in alert metrics and conditions in Splunk APM for more information about alert conditions.
You can also use AutoDetect detectors that are available by default for service latency, error rate, and request rate. See Use and customize AutoDetect alerts and detectors for more information.
Create an APM detector 🔗
There are several entry points for creating APM detectors.
From the Splunk Observability Cloud create menu 🔗
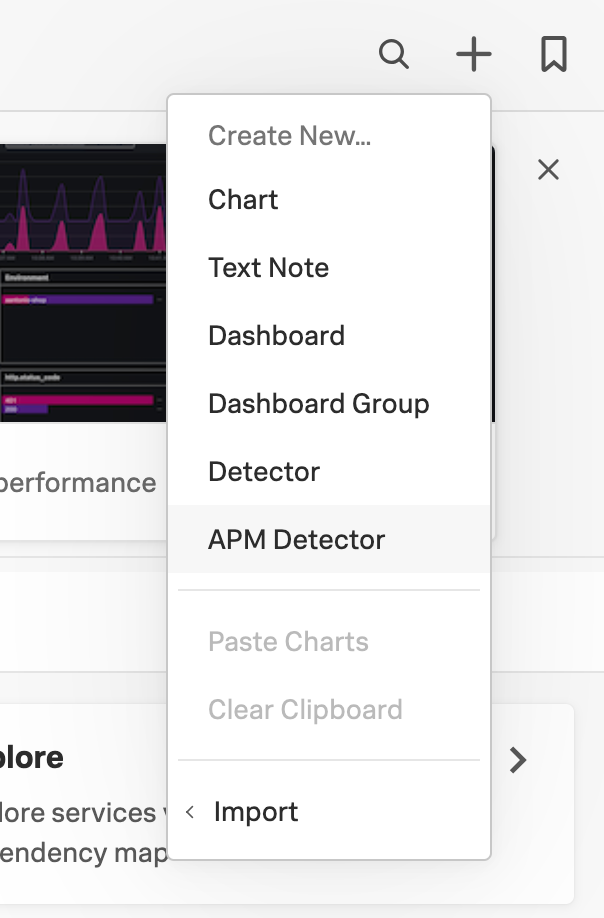
Select the plus icon to open the create menu (plus sign) on the navigation bar.
Select APM Detector.
See Steps to create a detector to complete your detector configuration.
From a dashboard 🔗
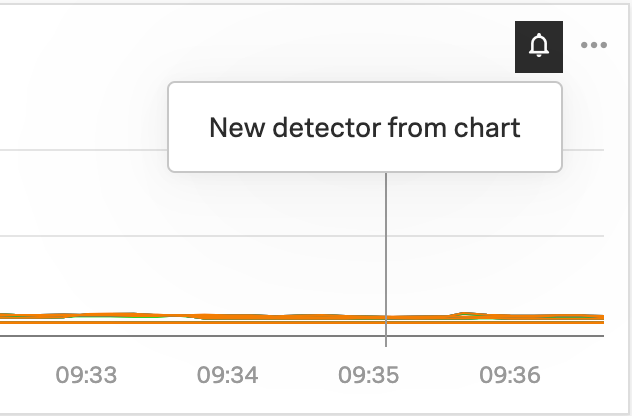
To create an APM detector from Splunk APM dashboards, select the bell icon within a specific chart in the dashboard and select New detector from chart. See Steps to create a detector to complete your detector configuration.
From Tag Spotlight in Splunk APM 🔗
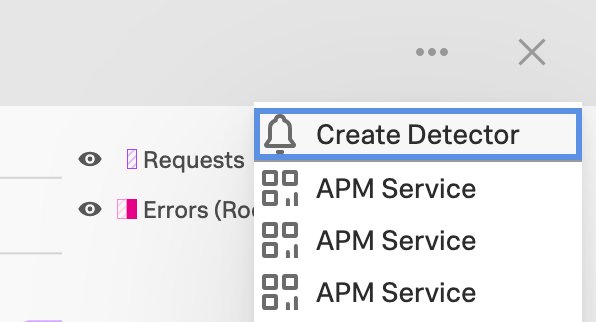
To create an APM detector from Tag Spotlight in Splunk APM, select the 3-dot menu from the Tag Spotlight menu bar and select Create Detector. See Steps to create a detector to complete your detector configuration.
From the landing page in Splunk APM 🔗
To create an APM detector from the landing page in Splunk APM, select the 3-dot icon to open the More menu in the metric charts for services and Business Workflows under the APM Overview and select Create Detector. See Steps to create a detector to complete your detector configuration.

From the service map in Splunk APM 🔗
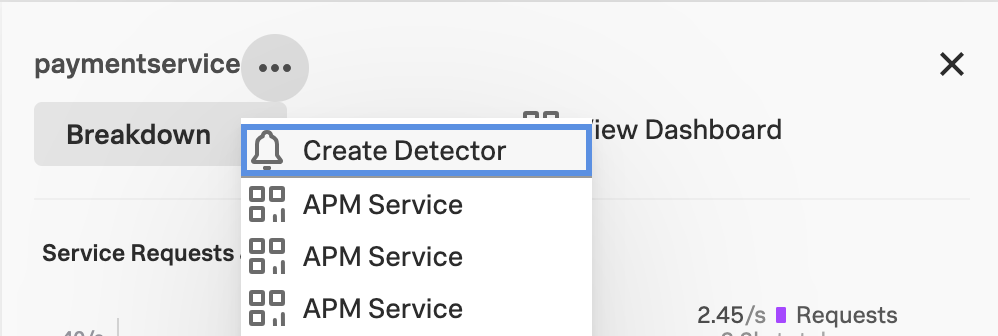
To create an APM detector from the service map in Splunk APM, select a service from the service map. Then, select the 3-dot icon in the panel for the service and select Create Detector. See Steps to create a detector to complete your detector configuration.
Steps to create a detector 🔗
Follow these steps to create a detector for Splunk APM:
Name your detector.
Select your metric. You can select request rate, error rate, or latency for a workflow, service, or endpoint.
Set the condition for your alert: Static threshold, Sudden change, or Historic anomaly. See Use built-in alert metrics and conditions in Splunk APM for more information about alert conditions.
Select the scope of your alert. You can select specific environments, workflows, services, and endpoints.
- Configure your alert details:
See Static Threshold to review options for the static threshold condition.
See Sudden Change to review options for the static threshold condition.
See Historical Anomaly to review options for the static threshold condition.
Select the alert severity. See Severity for more information about alert severity.
(Optional) Share your alert with others by integrating with your team’s incident response tool and add a link to your runbook.
Select Activate.