Track service performance using dashboards in Splunk APM 🔗
Splunk APM provides a set of built-in dashboards that present charts and visualized metrics to help you see problems occurring in real time and quickly determine whether the problem is associated with a service, a specific endpoint, or the underlying infrastructure. To learn about dashboards in Splunk Observability Cloud, see Dashboards in Splunk Observability Cloud.
The following image shows an example service dashboard for paymentservice.
APM dashboards present request, error, and duration (RED) metrics based on Monitoring MetricSets created from endpoint spans for your services, endpoints, and Business Workflows. They also present related host and Kubernetes metrics to help you determine whether problems are related to the underlying infrastructure, as in the following image.
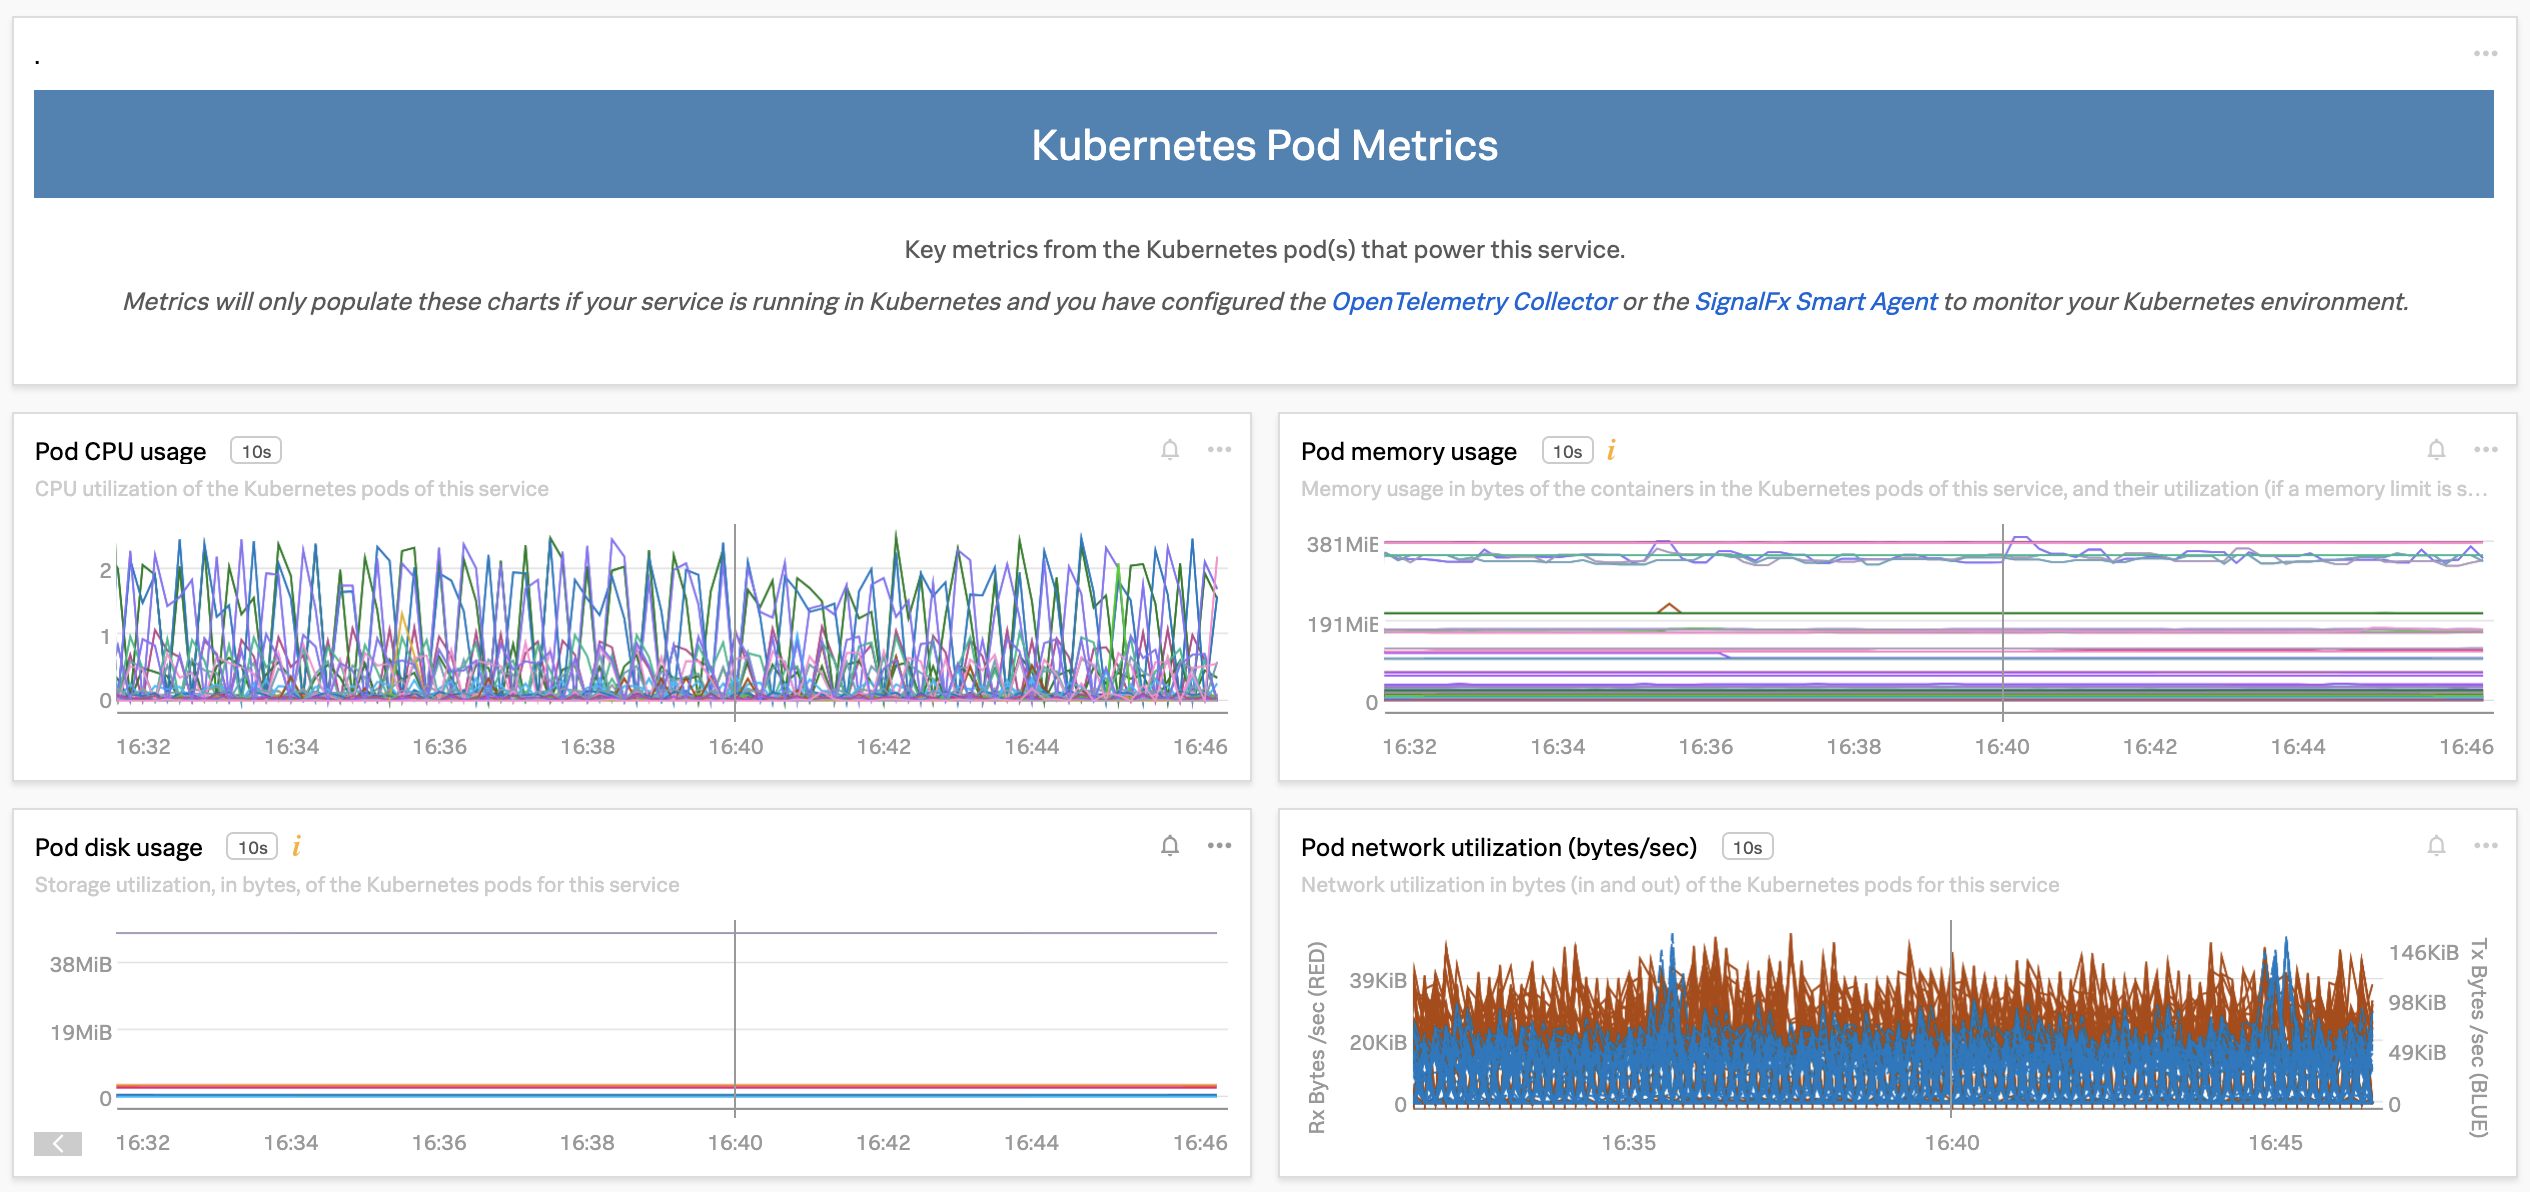
To view host and Kubernetes metrics in your dashboards, you need to have a Splunk Distribution of OpenTelemetry Collector instance installed on your hosts and clusters. See Deploy the Splunk Distribution of the OpenTelemetry Collector on your hosts to learn how.
Note
See Scenario: Deepu monitors service performance using a built-in dashboard for a scenario involving built-in dashboards in Splunk APM.
You can customize built-in dashboards to present the information you’re most interested in, or build your own from scratch. To learn more, see Customize APM dashboards.
You can also create detectors directly from dashboards to receive alerts on the problems that matter most to you. See Create a detector from a dashboard to learn how.
Use dashboards to troubleshoot issues in APM 🔗
You can navigate from within a dashboard directly to the relevant troubleshooting view with all the relevant data populated. In a dashboard, select the more menu (⋯) within a chart and select Troubleshoot from the Time Window to open the troubleshooting view (which includes the service map). The dashboard’s filters are preserved so that you can continue troubleshooting issues in context.
See Scenario: Kai investigates the root cause of an error with the Splunk APM service map for a sample scenario of the troubleshooting view in Splunk APM.
Note
Dashboards are powered by Monitoring MetricSets, which are based on service endpoints. For this reason, dashboards only display data when the selected service has at least one instrumented endpoint.
Customize APM dashboards 🔗
You can customize your dashboard by setting filters, chart type, and chart resolution on a pre-built dashboard.
Edit a specific chart by selecting its more menu (⋯) and selecting Open. This opens a detailed chart editor you can use to adjust chart type, axis labels, formulas, and more. Once you edit a chart or dashboard, select the more menu (⋯) and select Save As from the dropdown to save your customizations for future reference.
You can also create a new dashboard from scratch. See Create a dashboard to learn more. See Create and manage dashboard groups to learn how you can share your custom dashboards in groups.
Use SignalFlow to create charts 🔗
The dashboard editor provides a lot of customization options for your charts, but if you need even more flexibility, you can use SignalFlow to run calculations and create charts from your data. See the Analyze Data Using SignalFlow topic in the Splunk Observability Cloud Developer Guide to learn more.
Note
See Best practices for creating dashboards in Splunk Observability Cloud for more tips on building informative dashboards.
Create a detector from a dashboard 🔗
Prerequisite 🔗
To create a detector from a dashboard, you must have the admin or power user role.
To create a detector from a dashboard, select the bell icon within a specific chart in the dashboard and select New Detector From Chart.
If you don’t have write permissions on the dashboard you’re viewing, a Detector Linking pop-up informs you the detector is not linked directly to the dashboard. You can select Ok to proceed, or save a copy of the dashboard to gain write permissions so that you can create a linked detector based on your new dashboard. To learn more about linking detectors, see Link detectors to charts.
In the New APM Detector window, enter a name for your detector and follow the steps in the guided setup to configure your detector, or see Configure detectors and alerts in Splunk APM for more information.