Memory profiling metrics 🔗
AlwaysOn Profiling provides memory metrics that you can use to build dashboards and set up alerts. The following image shows a sample dashboard of JVM memory metrics for a service:
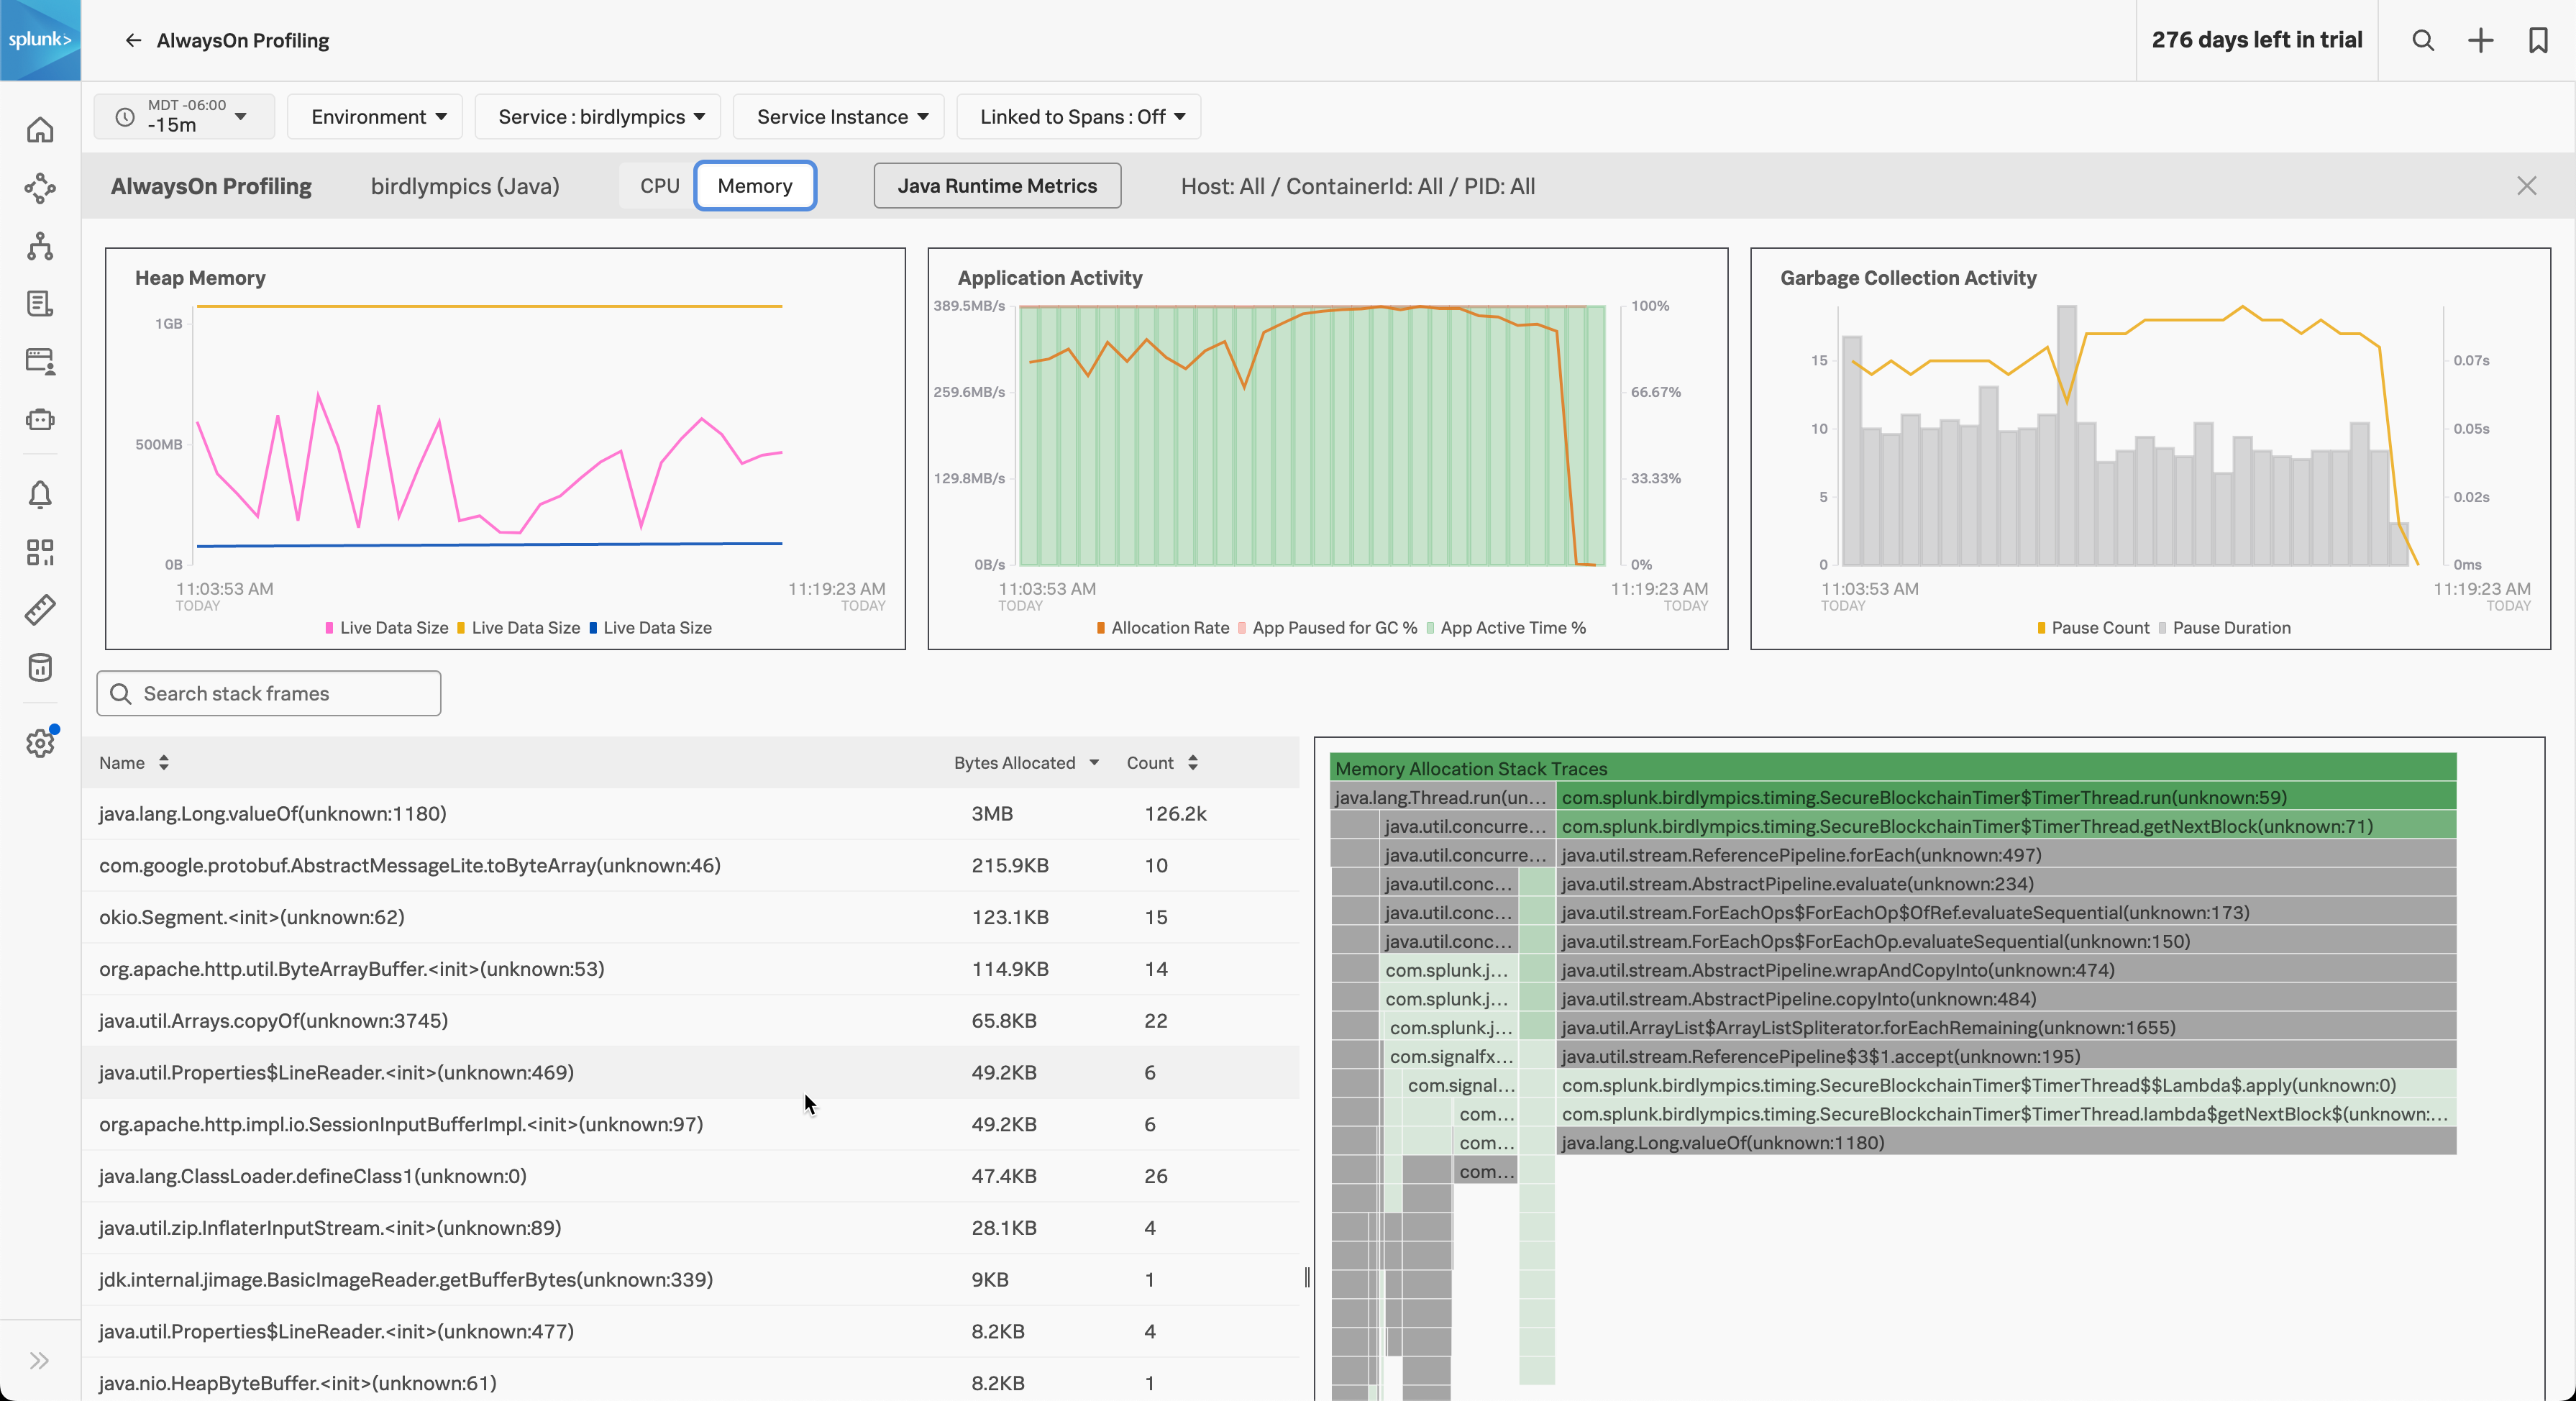
For more information on dashboards, see Create and customize dashboards.
The list of available memory metrics depends on the programming language. See Get data into Splunk APM AlwaysOn Profiling for supported languages.
Java runtime metrics dashboard 🔗
Use the configured dashboard for JVM metrics to check memory usage. To access the the Java runtime metrics dashboard, follow these steps:
Go to Dashboards from the navigation menu in Splunk Observability Cloud.
On the dashboard landing page under the built-in dashboard group, select either APM java services or APM Java services (OTel 2.x) depending on whether you are using version 1.0 or 2.0 of the Splunk Distribution of OpenTelemetry Java. Anyone can access this group by default.
Select either the Java runtime metrics dashboard or the Java runtime metrics (Otel 2.x) dashboard.
Node.js Runtime Metrics dashboard 🔗
You can access a configured dashboard for Node.js runtime metrics to check memory usage. There are two ways to access the Node.js Runtime Metrics dashboard.
From the dashboards 🔗
Go to Dashboards from the navigation menu in Splunk Observability Cloud.
On the dashboard landing page and select the APM NodeJS services built-in dashboard group. Anyone can access this group by default.
Select the NodeJS runtime metrics dashboard.
From Splunk APM 🔗
Go to AlwaysOn Profiling from within APM.
Select a service.
Select Node.js Runtime Metrics to navigate to the runtime metrics dashboard.
.NET Runtime Metrics dashboard 🔗
You can access a configured dashboard for .NET runtime metrics to check memory usage. There are two ways to access the .NET Runtime Metrics dashboard.
From the dashboards 🔗
Go to Dashboards from the navigation menu in Splunk Observability Cloud.
On the dashboard landing page and select the APM .NET services built-in dashboard group. Anyone can access this group by default.
Select the .NET runtime metrics dashboard.
From Splunk APM 🔗
Go to AlwaysOn Profiling from within APM.
Select a service.
Select .NET Runtime Metrics to navigate to the runtime metrics dashboard.