Connect AWS to Splunk Observability Cloud 🔗
Splunk Observability Cloud offers you several data ingestion and connection methods to monitor your Amazon Web Services (AWS) data.
Note
If you want to send AWS data to the Splunk platform, use the Splunk add-on. Learn more at Splunk Add-on for AWS .
Before you start, see AWS authentication, permissions, and supported regions, and check the Supported AWS integrations in Splunk Observability Cloud.
See a comparison of the connection options at Compare AWS connection options, and choose the connection method that best matches your needs:
Connection option |
Available at |
|---|---|
Use either the Splunk Observability Cloud UI guided setup or the Splunk Observability Cloud API. |
|
Use either the Splunk Observability Cloud UI guided setup or the Splunk Observability Cloud API. |
|
Connect and manage Metric Streams from the AWS console. |
|
If you already manage your infrastructure as code, continue deploying through Splunk Terraform. |
Note
If you can’t connect AWS to Splunk Observability Cloud, see Troubleshoot your AWS connection.
There are constraints to consider in terms of high data volume and filtering.
Splunk Observability Cloud doesn’t limit the number of AWS service integrations you can configure. However, if you’re planning to use over 100 AWS integrations, contact Splunk Observability Cloud support.
After you create an AWS integration, if it retrieves more than 100,000 metrics from CloudWatch, Splunk Observability Cloud automatically deactivates the integration and sends you a warning email.
This check runs once per integration. If you activate the integration afterwards, it will work correctly.
You can deactivate this check by setting the enableCheckLargeVolume field in the AWS integration to false using the API. See the API reference guide in the Splunk Observability developer docs.
If you filter data based on tags, your costs for Amazon CloudWatch and Splunk Observability Cloud might decrease. Read more at Control the data and metadata to import.
Be careful when choosing tag names. Splunk Observability Cloud only allows alphanumeric characters (lower and upper case latin letters and digits), the underscore ( _ ) and the minus/hyphen ( - ) symbols. Spaces and unsupported characters are replaced by the underscore character.
The following characters are not supported. This list is not exhaustive.
periods (
.)colons (
:)forward slashes (
/)equal signs (
=)plus signs (
+)at symbols (
@)
For more information on tagging see AWS data in Splunk Observability Cloud.
CloudWatch Metric Streams supports filtering by namespace and metric name but doesn’t support filtering based on resource tags.
By default Splunk Observability Cloud brings in data from all supported AWS services associated with your account, with certain limitations. See Supported integrations in Splunk Observability Cloud for a complete list of the services supported by default.
To manage the amount of data to import, see Manage Amazon Web Services data import.
Custom services
You can also collect data from any custom service you’ve created in AWS, or from any namespace defined by AWS that Splunk Observability Cloud doesn’t support by default. You can select which custom services to monitor at the Splunk Observability Cloud UI or configure them using the API .
Imported stats
If you connect your AWS services using the UI, Splunk Observability Cloud brings in 5 default stats per service: SampleCount (count in Splunk Observability Cloud), Average (mean), Sum (sum), Minimum (lower), and Maximum (upper).
If you connect your services using the API you can choose to import certain stats only. These stats are based on AWS’ own recommended stats and vary with each service. See the list of recommended stats used by Splunk Observability Cloud.
Caution
Splunk Observability Cloud is not responsible for data availability.
Depending on your configuration, it might take up to several minutes from the time you connect until you start seeing valid data from your account.
If you’re streaming data with Metric Streams, the configured buffering settings on the Kinesis Data Firehose delivery stream determine how long it takes for data to appear.
Buffering is expressed in maximum payload size or maximum wait time, whichever is reached first.
If set to the minimum values (60 seconds or 1MB) the expected latency is within 3 minutes if the selected CloudWatch namespaces have active streams.
In most cases, metrics are reported every minute. However, some services use a different cadence. For example, selected S3 metrics are reported on a daily basis. Check the AWS documentation to verify how often your services’ metrics are reported.
Collecting Amazon CloudWatch metrics through the polling APIs at the default polling rate of 300 seconds (5 minutes) is usually cheaper than using Metric Streams. On the other hand, if you set polling intervals to 1 minute, generally you see an increase in Amazon CloudWatch usage costs compared to Metric Streams.
Learn more at Costs for AWS monitoring.
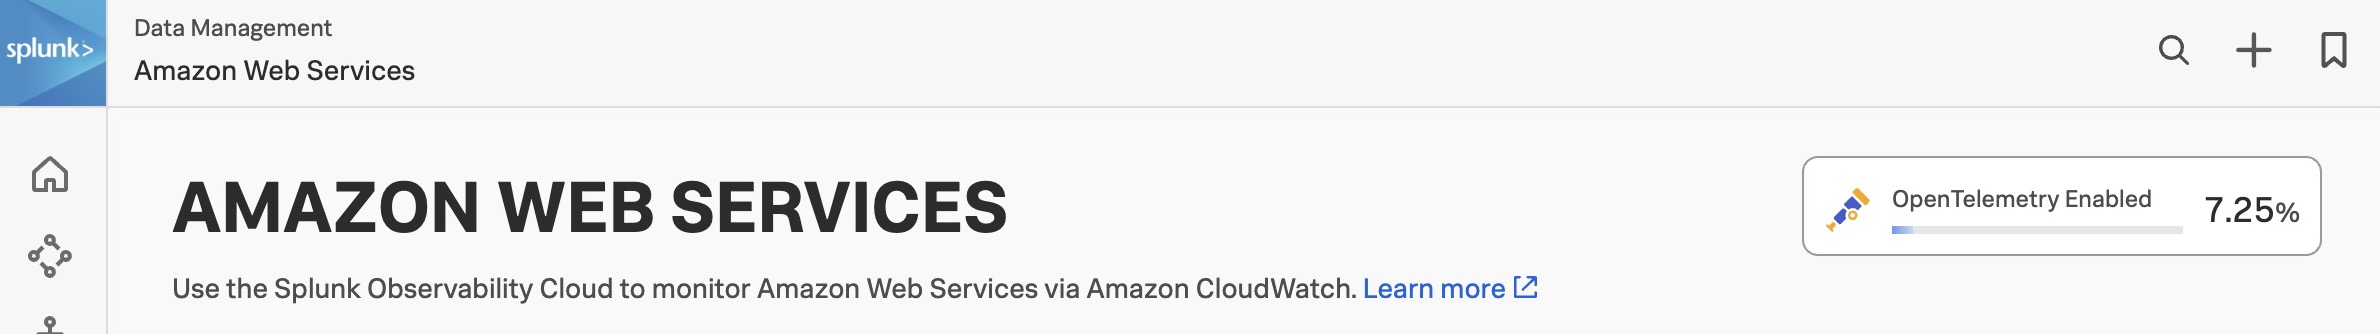
To take advantage of the full benefits of the Splunk Observability Cloud platform, install the Splunk Distribution of the OpenTelemetry Collector.
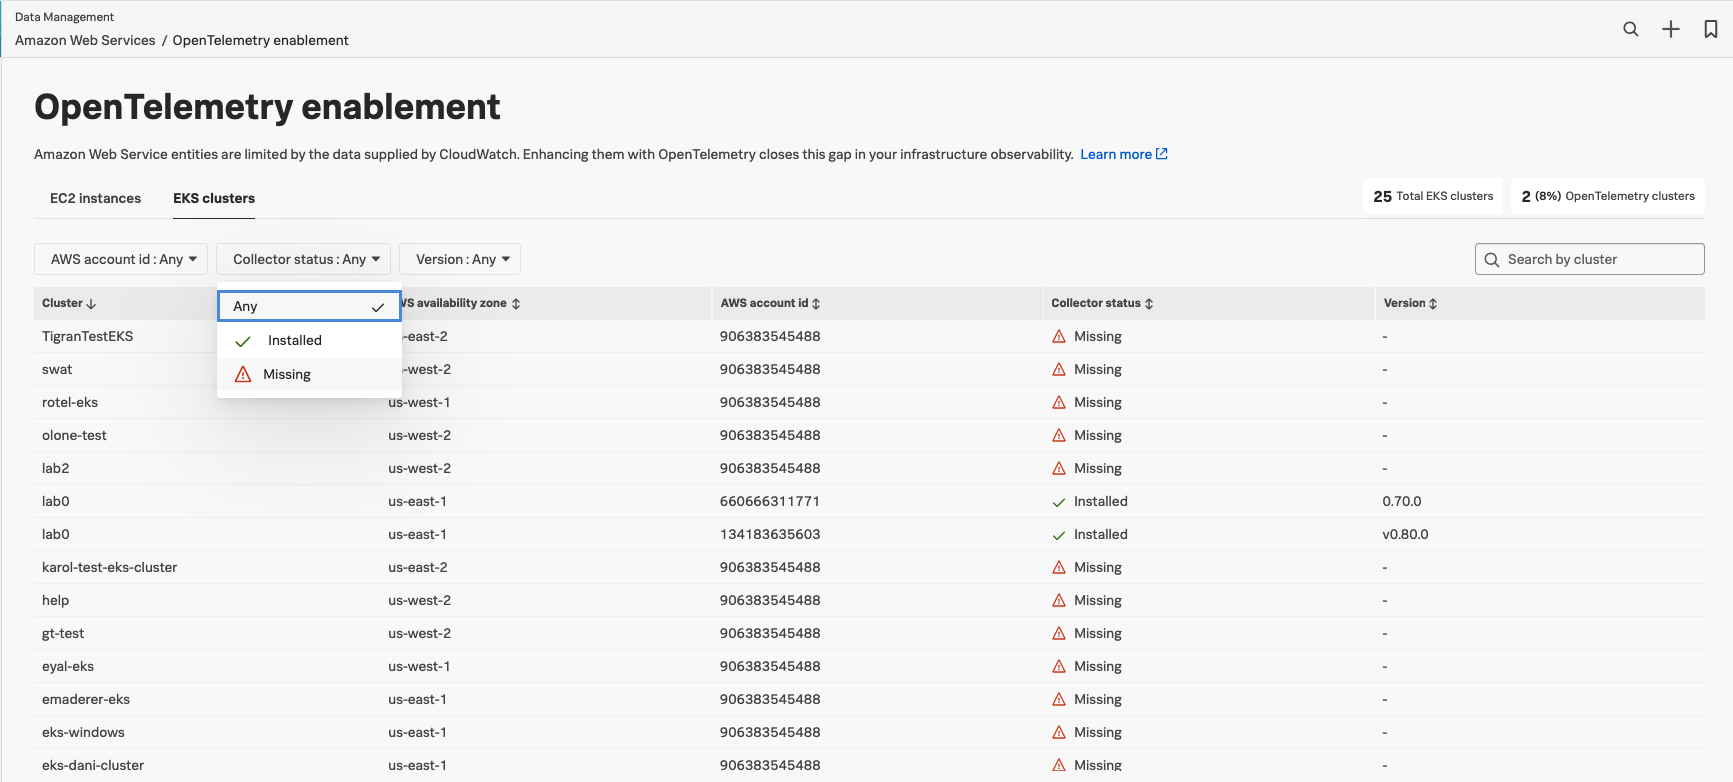
To track the degree of OpenTelemetry enablement in your AWS integrations:
From Splunk Observability Cloud, go to Data Management > Deployed integrations > AWS.
Select either the AWS EC2 or AWS EKS tabs to see whether the OTel Collector is installed on each AWS EC2 instance or AWS EKS cluster. This helps you identify the instances that still need to be instrumented.
For OTel Collector instances that are successfully instrumented, you can see which version of the Collector is deployed.
Splunk Observability Cloud also offers secured connectivity with AWS. For more information, see Private Connectivity using AWS PrivateLink.
For a walkthrough of tasks related to using AWS cloud services with your infrastructure, see Tutorial: Configure the Splunk Distribution of OpenTelemetry Collector on a Linux host.
See Leverage data from integration with AWS for an overview of what you can do after you connect Splunk Observability Cloud to AWS.
Find instructions on how to import AWS metrics and metadata such as tags using namespaces and filters at Monitor AWS services.
Refer to the AWS official documentation for a list of the available AWS metrics and other data, or read about the metadata Splunk Observability Cloud can provide at AWS CloudWatch metadata.
To collect traces and metrics of your AWS Lambda functions for Splunk APM, see Instrument AWS Lambda functions for Splunk Observability Cloud.