Collector deployment modes 🔗
You can deploy the Splunk Distribution of the OpenTelemetry Collector in one of two deployment modes: host monitoring (agent) mode and data forwarding (gateway) mode.
Note
See also the official OpenTelemetry project docs at Deployment: Patterns you can apply to deploy the OpenTelemetry Collector .
Host monitoring (agent) mode 🔗
In host monitoring (agent) mode, the Collector runs with the application or on the same host as the application, and sends data directly to Splunk Observability Cloud. If deployed as a standalone agent, the Splunk Distribution of the OpenTelemetry Collector is the only component deployed and configured.
The following image shows the architecture for the standalone mode:
Data flow depends on your environment. Learn more at Get started with the Splunk Distribution of the OpenTelemetry Collector.
When to use host monitoring (agent) mode 🔗
Use the host monitoring (agent) mode when you want to do these things:
Configure instrumentation. Host monitoring (agent) mode offloads responsibilities from the application including batching, queuing, and retrying.
Collect host and application metrics, as well as host and application metadata enrichment for metrics, spans, and logs.
Data forwarding (gateway) mode 🔗
Data forwarding (gateway) mode is typically deployed per cluster, data center, or region. A Collector in gateway mode collects data both from Kubernetes and from one or more Collectors running in standalone agent mode and sends it to Splunk Observability Cloud. For the default gateway config file see data forwarding (gateway) mode configuration in GitHub .
The following image shows the architecture for the data forwarding (gateway) mode:
Note
To forward metrics and metadata in data forwarding (gateway) mode, see Metrics and metadata not available in data forwarding (gateway) mode.
When to use data forwarding (gateway) mode 🔗
While optional, the Collector in gateway mode is beneficial for large-scale Kubernetes deployments, and you might consider adding a gateway Collector in big clusters. There isn’t a strict rule for defining a large-scale Kubernetes setup due to varying host specifications, host and node numbers, and telemetry volume, although 25 hosts is sometimes considered the limit for a small environment.
Use data forwarding (gateway) mode when you want to do one of the following:
Configure a larger buffer.
Configure an increased wait interval for retry attempts.
Limit the number of egress points required to send data.
Consolidate API token management. See more in Token usage with a Collector in data forwarding (gateway) mode.
Token usage with a Collector in data forwarding (gateway) mode 🔗
In a set-up where Collectors in host monitoring (agent) mode send data to another Collector in data forwarding (gateway) mode, agent Collectors don’t send the data directly to the Splunk Observability Cloud back-end. In this case, only the ingest token in the gateway Collector is used, and tokens in the Collectors that are sending data to a gateway are ignored, unless they’re using the SignalFx exporter. Therefore, you only need one valid token for the gateway Collector to see data in Splunk Observability Cloud, and the rest of Collectors could have invalid or expired tokens.
Token usage with the SignalFx exporter 🔗
If any of your Collectors in agent mode is using the SignalFx exporter with the default configuration or if the exporter’s setting access_token_passthrough is set to true, then data from that specific Collector will be sent to Splunk Observability Cloud using the Collector’s access token instead of the Gateway Collector’s token.
Learn more at SignalFx exporter.
Token usage with the otlphttp exporter 🔗
If any of your Collectors in agent mode exports data to the otlp receiver running on the gateway and you want to use the token set at the source instead of the gateway’s token, uncomment include_metadata: true in the default gateway config.
For more details see Default gateway config in GitHub and Associate passthroughs to an access token.
What mode is my Collector deployed as? How can I change it? 🔗
If you install the Collector using the provided scripts, the Collector is deployed in the mode specified in your configuration file.
Linux and Windows 🔗
For Windows and Linux installers, the default configuration yaml sets the Collector as an agent.
The path to the configuration yaml is set in the env variable SPLUNK_CONFIG and is, by default:
Linux:
/etc/otel/collector/<gateway or agent>_config.yamlWindows:
C:\ProgramData\Splunk\OpenTelemetry Collector\<gateway or agent>_config.yaml
To change the deployment mode, modify SPLUNK_CONFIG for the path to the gateway configuration yaml file instead. See Data forwarding (gateway) mode for details on the data forwarding (gateway) mode yaml.
Kubernetes 🔗
The Collector for Kubernetes has different deployment options. You can configure them using the enabled field in their respective Helm value mappings. See Advanced configuration for Kubernetes for information on how to access your configuration yaml.
The main deployment modes are:
Default, which includes the
agentDaemonSet and theclusterReceiverdeployment component.All collector modes, which includes
agentDaemonSet, and theclusterReceiverand thegatewaycomponents.
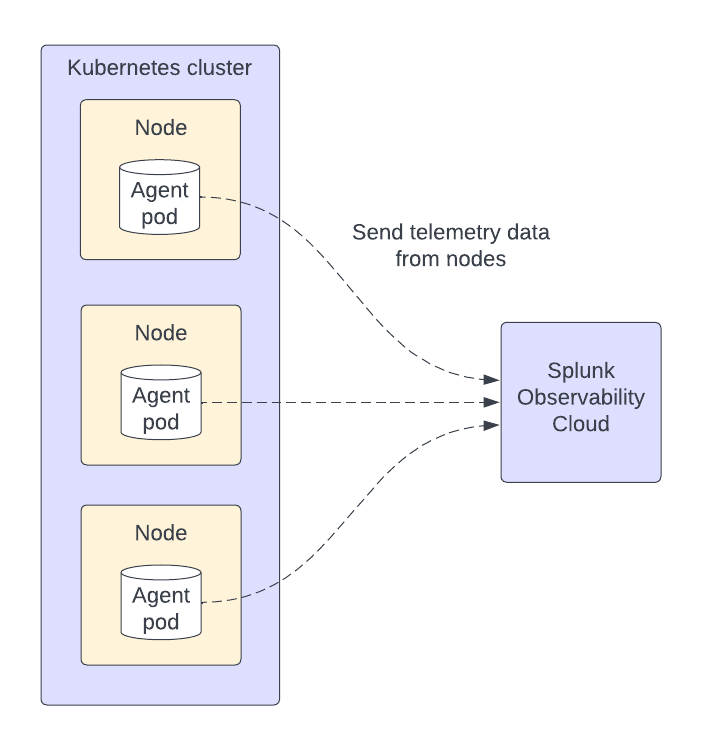
By default, the agent DaemonSet deploys a pod running the OpenTelemetry Collector agent in each node of your Kubernetes cluster. The agent pods gather data from your applications, services, and other objects running in their respective nodes, then send the data to Splunk Observability Cloud.
For more information on the components on each mode, see Helm chart architecture and components.
Change the deployment mode in a Kubernetes environment 🔗
If you want to change the Collector mode, deploy a new Helm chart with the desired configuration to override the existing config. See Rolling update deployment in the official Kubernetes documentation.
You can find the different Helm charts in Github:
Send data from an agent Collector to a gateway Collector 🔗
You can manually configure a host monitoring (agent) Collector to send data to a Splunk Distribution of the OpenTelemetry Collector gateway instance or cluster. This requires changing the pipeline exporters in the agent to point to the gateway.
To configure the Collector to send data to the another Collector in data forwarding (gateway) mode, see these configurations:
Agent configuration 🔗
In the host monitoring (agent) mode configuration file , update the SPLUNK_GATEWAY_URL environment variable to the URL of the gateway.
You might also need to check the following:
Update the
SPLUNK_API_URLenvironment variable to the URL of the gateway, specifying the ingress port, which is6060by default.Update the
SPLUNK_INGEST_URLenvironment variable to the URL of the gateway, specifying the ingress port, which is9943by default.Make sure that metrics, traces, and logs pipelines send data to the appropriate receivers on the gateway.
To activate trace correlation, use the signalfx exporter in the traces pipeline. All other pipelines between the agent and the gateway can use the otlp exporter, which is more efficient.
Note
If you are using the otlp exporter for metrics, the hostmetrics aggregation takes place in the gateway.
The following example shows how to configure the Collector in host monitoring (agent) mode to send data to a gateway Collector:
receivers:
   hostmetrics:
      collection_interval: 10s
      scrapers:
         cpu:
         disk:
         filesystem:
         memory:
         network:
# More receivers

processors:
   resourcedetection:
      detectors: [system,env,gce,ec2]
      override: true
   resource/add_environment:
      attributes:
         - action: insert
            value: staging
            key: deployment.environment
# More processors

exporters:
   # Traces
   otlp:
      endpoint: "${SPLUNK_GATEWAY_URL}:4317"
      tls:
         insecure: true
   # Metrics, events, and APM correlation calls
   signalfx:
      access_token: "${SPLUNK_ACCESS_TOKEN}"
      api_url: "http://${SPLUNK_GATEWAY_URL}:6060"
      ingest_url: "http://${SPLUNK_GATEWAY_URL}:9943"
      sync_host_metadata: true
      correlation:
   # Logs
   otlp:
      endpoint: "${SPLUNK_GATEWAY_URL}:4317"
# More exporters

service:
   extensions: [health_check, http_forwarder, zpages]
   pipelines:
      traces:
         receivers: [jaeger, zipkin]
         processors: [memory_limiter, batch, resourcedetection, resource/add_environment]
         exporters: [otlp, signalfx]
      metrics:
         receivers: [hostmetrics]
         processors: [memory_limiter, batch, resourcedetection]
         exporters: [otlp]
      metrics/internal:
         receivers: [prometheus/internal]
         processors: [memory_limiter, batch, resourcedetection]
         exporters: [signalfx]
      logs:
         receivers: [otlp]
         processors: [memory_limiter, batch, resourcedetection]
         exporters: [otlp]
   # More pipelines
Gateway configuration 🔗
Change the following sections of the data forwarding (gateway) mode configuration file :
Make sure that the receivers match the exporters in the agent configuration.
Set the Collector in data forwarding (gateway) mode to listen to requests on ports 4317, 6060 and 9943.
Update the
SPLUNK_GATEWAY_URLenvironment variable tohttps://api.${SPLUNK_REALM}.signalfx.com.
To set the Collector in data forwarding (gateway) mode to receiving data from an agent, use the following configuration:
extensions:
   http_forwarder:
      egress:
         endpoint: "https://api.${SPLUNK_REALM}.signalfx.com"
# More extensions

receivers:
   otlp:
      protocols:
         grpc:
         http:
   signalfx:
# More receivers

exporters:
   # Traces (Agent)
   otlphttp:
      access_token: "${SPLUNK_ACCESS_TOKEN}"
      endpoint: "https://ingest.${SPLUNK_REALM}.signalfx.com/v2/trace/otlp"
   # Metrics + Events (Agent)
   signalfx:
      access_token: "${SPLUNK_ACCESS_TOKEN}"
      realm: "${SPLUNK_REALM}"
   # Metrics + Events (Gateway)
   signalfx/internal:
      access_token: "${SPLUNK_ACCESS_TOKEN}"
      realm: "${SPLUNK_REALM}"
      sync_host_metadata: true
# More exporters

service:
   extensions: [http_forwarder]
   pipelines:
      traces:
         receivers: [otlp]
         processors:
         - memory_limiter
         - batch
         exporters: [otlphttp]
      metrics:
         receivers: [otlp]
         processors: [memory_limiter, batch]
         exporters: [signalfx]
      metrics/internal:
         receivers: [prometheus/internal]
         processors: [memory_limiter, batch, resourcedetection/internal]
         exporters: [signalfx/internal]
   # More pipelines
Send metrics with the SignalFx exporter 🔗
If you want to use the SignalFx exporter for metrics on both agent and gateway, deactivate the aggregation at the Gateway. To do so, set the translation_rules and exclude_metrics to empty lists as in the following example.
Note
If you want to collect host metrics from the Gateway, use a different SignalFx exporter instance with the translation rules intact. For example, use the hostmetrics option in the metrics/internal pipeline.
receivers:
   hostmetrics:
      collection_interval: 10s
      scrapers:
         cpu:
         disk:
         filesystem:
         memory:
         network:

exporters:
   # Traces
   otlphttp:
      access_token: "${SPLUNK_ACCESS_TOKEN}"
      traces_endpoint: "https://ingest.${SPLUNK_REALM}.signalfx.com/v2/trace/otlp"
   # Metrics + Events (Agent)
   signalfx:
      access_token: "${SPLUNK_ACCESS_TOKEN}"
      realm: "${SPLUNK_REALM}"
      translation_rules: []
      exclude_metrics: []
   # Metrics + Events (Gateway)
   signalfx/internal:
      access_token: "${SPLUNK_ACCESS_TOKEN}"
      realm: "${SPLUNK_REALM}"
      sync_host_metadata: true

service:
   extensions: [http_forwarder]
   pipelines:
      traces:
         receivers: [otlp]
         processors:
         - memory_limiter
         - batch
         exporters: [otlphttp]
      metrics:
         receivers: [signalfx]
         processors: [memory_limiter, batch]
         exporters: [signalfx]
      metrics/internal:
         receivers: [prometheus/internal]
         processors: [memory_limiter, batch, resourcedetection/internal]
         exporters: [signalfx/internal]