Monitor the Collector with Splunk Observability Cloud’s built-in dashboards 🔗
Splunk Observability Cloud provides built-in dashboards with charts that give you immediate visibility into the technologies and services being used in your environment, including your deployed OTel Collector instances.
Learn more about the available built-in dashboards at and how to use them at Built-in dashboards. To know how to work with charts, and understand the types of charts available, see Charts in Splunk Observability Cloud.
Understand the data in the built-in Collector dashboard 🔗
The default configuration of the Splunk Distribution of the OpenTelementry Collector includes, among other components, the Prometheus receiver in the metrics/internal pipeline. This allows the receiver to send the Collector’s internal metrics that feed the built-in dashboard to Splunk Observability Cloud.
You can find the list of the Collector’s internal metrics at Internal metrics of the Collector.
Access the built-in Collector dashboard 🔗
To access the Collector built-in dashboard:
Log in to Splunk Observability Cloud.
Select Dashboards on the left navigation menu.
Use the search bar or browse down to locate the OpenTelementry Collector tile.
Select the link in the tile to access the built-in dashboard.
Use the built-in Collector dashboard 🔗
The built-in dashboard for the Collector has the following sections:
Each section contains a set of charts that give you information relevant to your deployments.
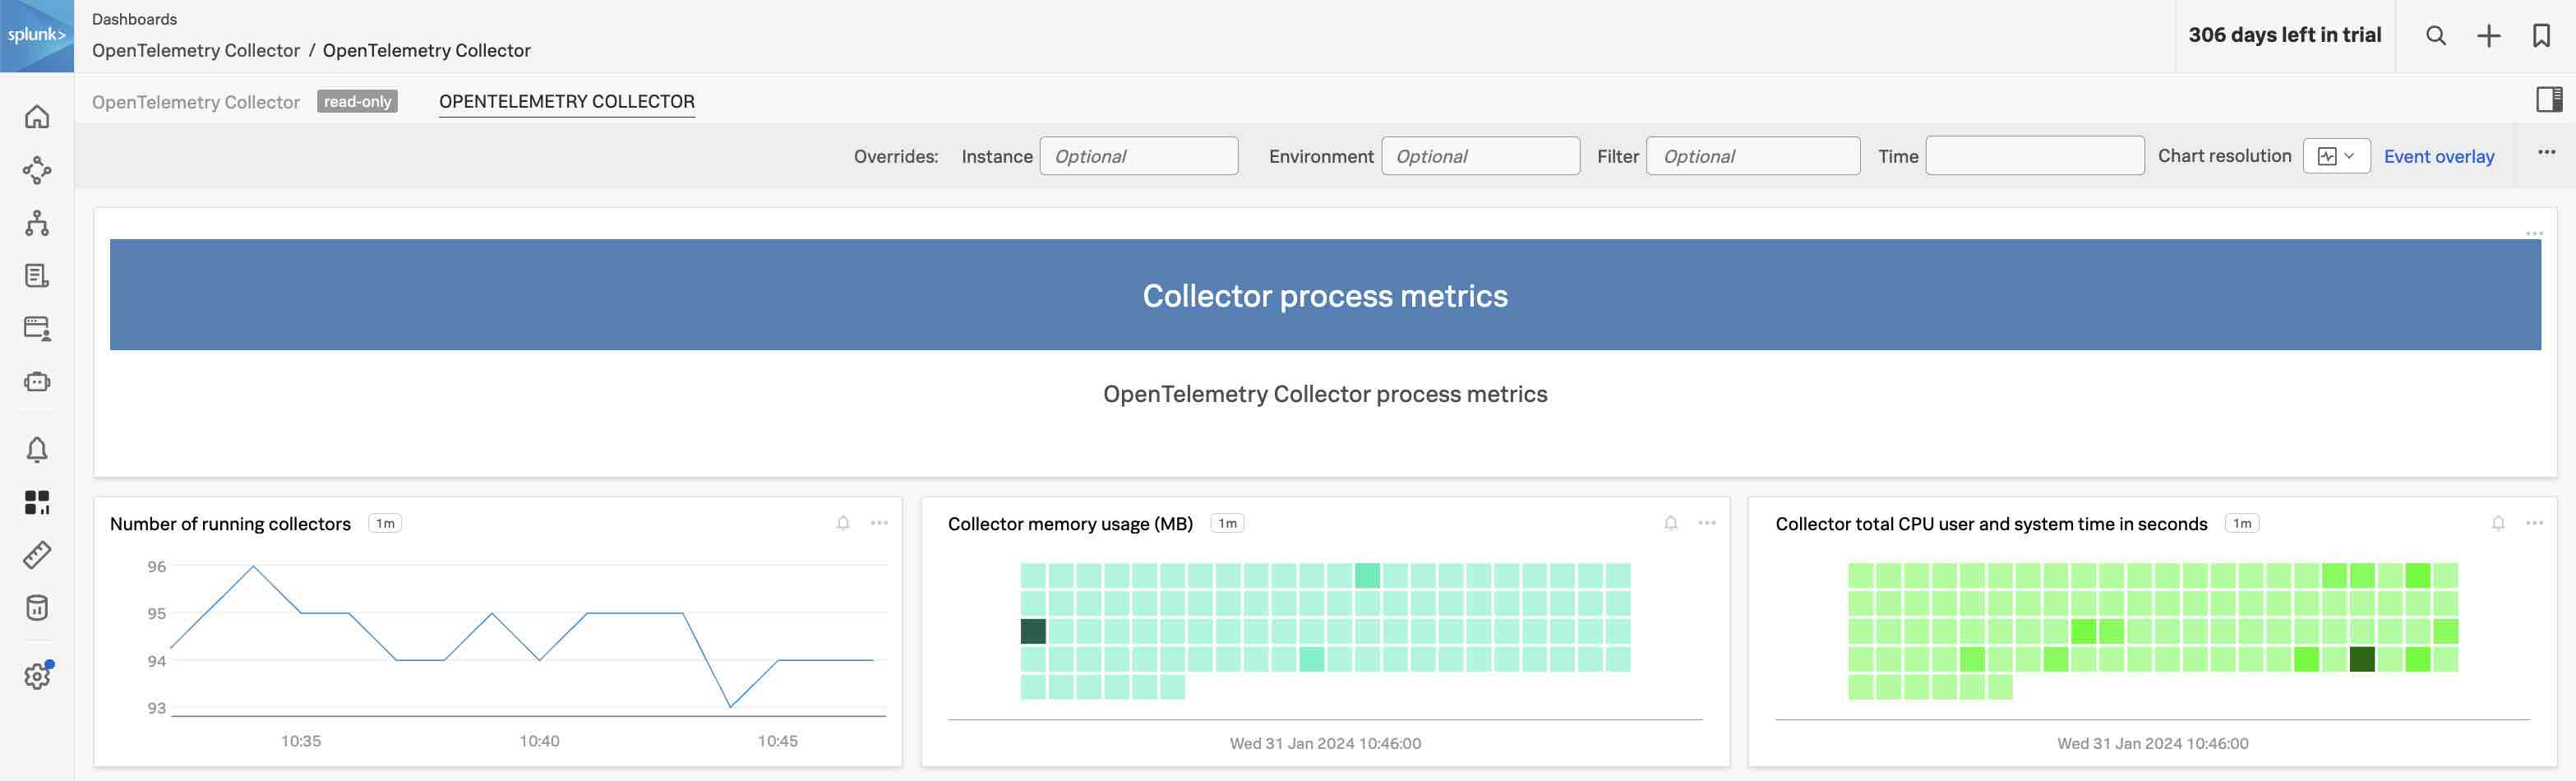
Collector process metrics 🔗
This section of the built-in dashboard contains three charts with basic metrics related to your Collector instances:
The number of Collector instances running
The Collectors’ memory usage, in MB
The Collectors’ total CPU time in seconds, per instance
Critical monitoring 🔗
Caution
This section of the dashboard focuses on dropped data and is essential to understand the health of your system. Investigate any value above zero.
This section is structured in three columns, one for each type of available data type: spans, metrics, and logs. For more information about the Splunk Observability Cloud data model, see Data types in Splunk Observability Cloud.
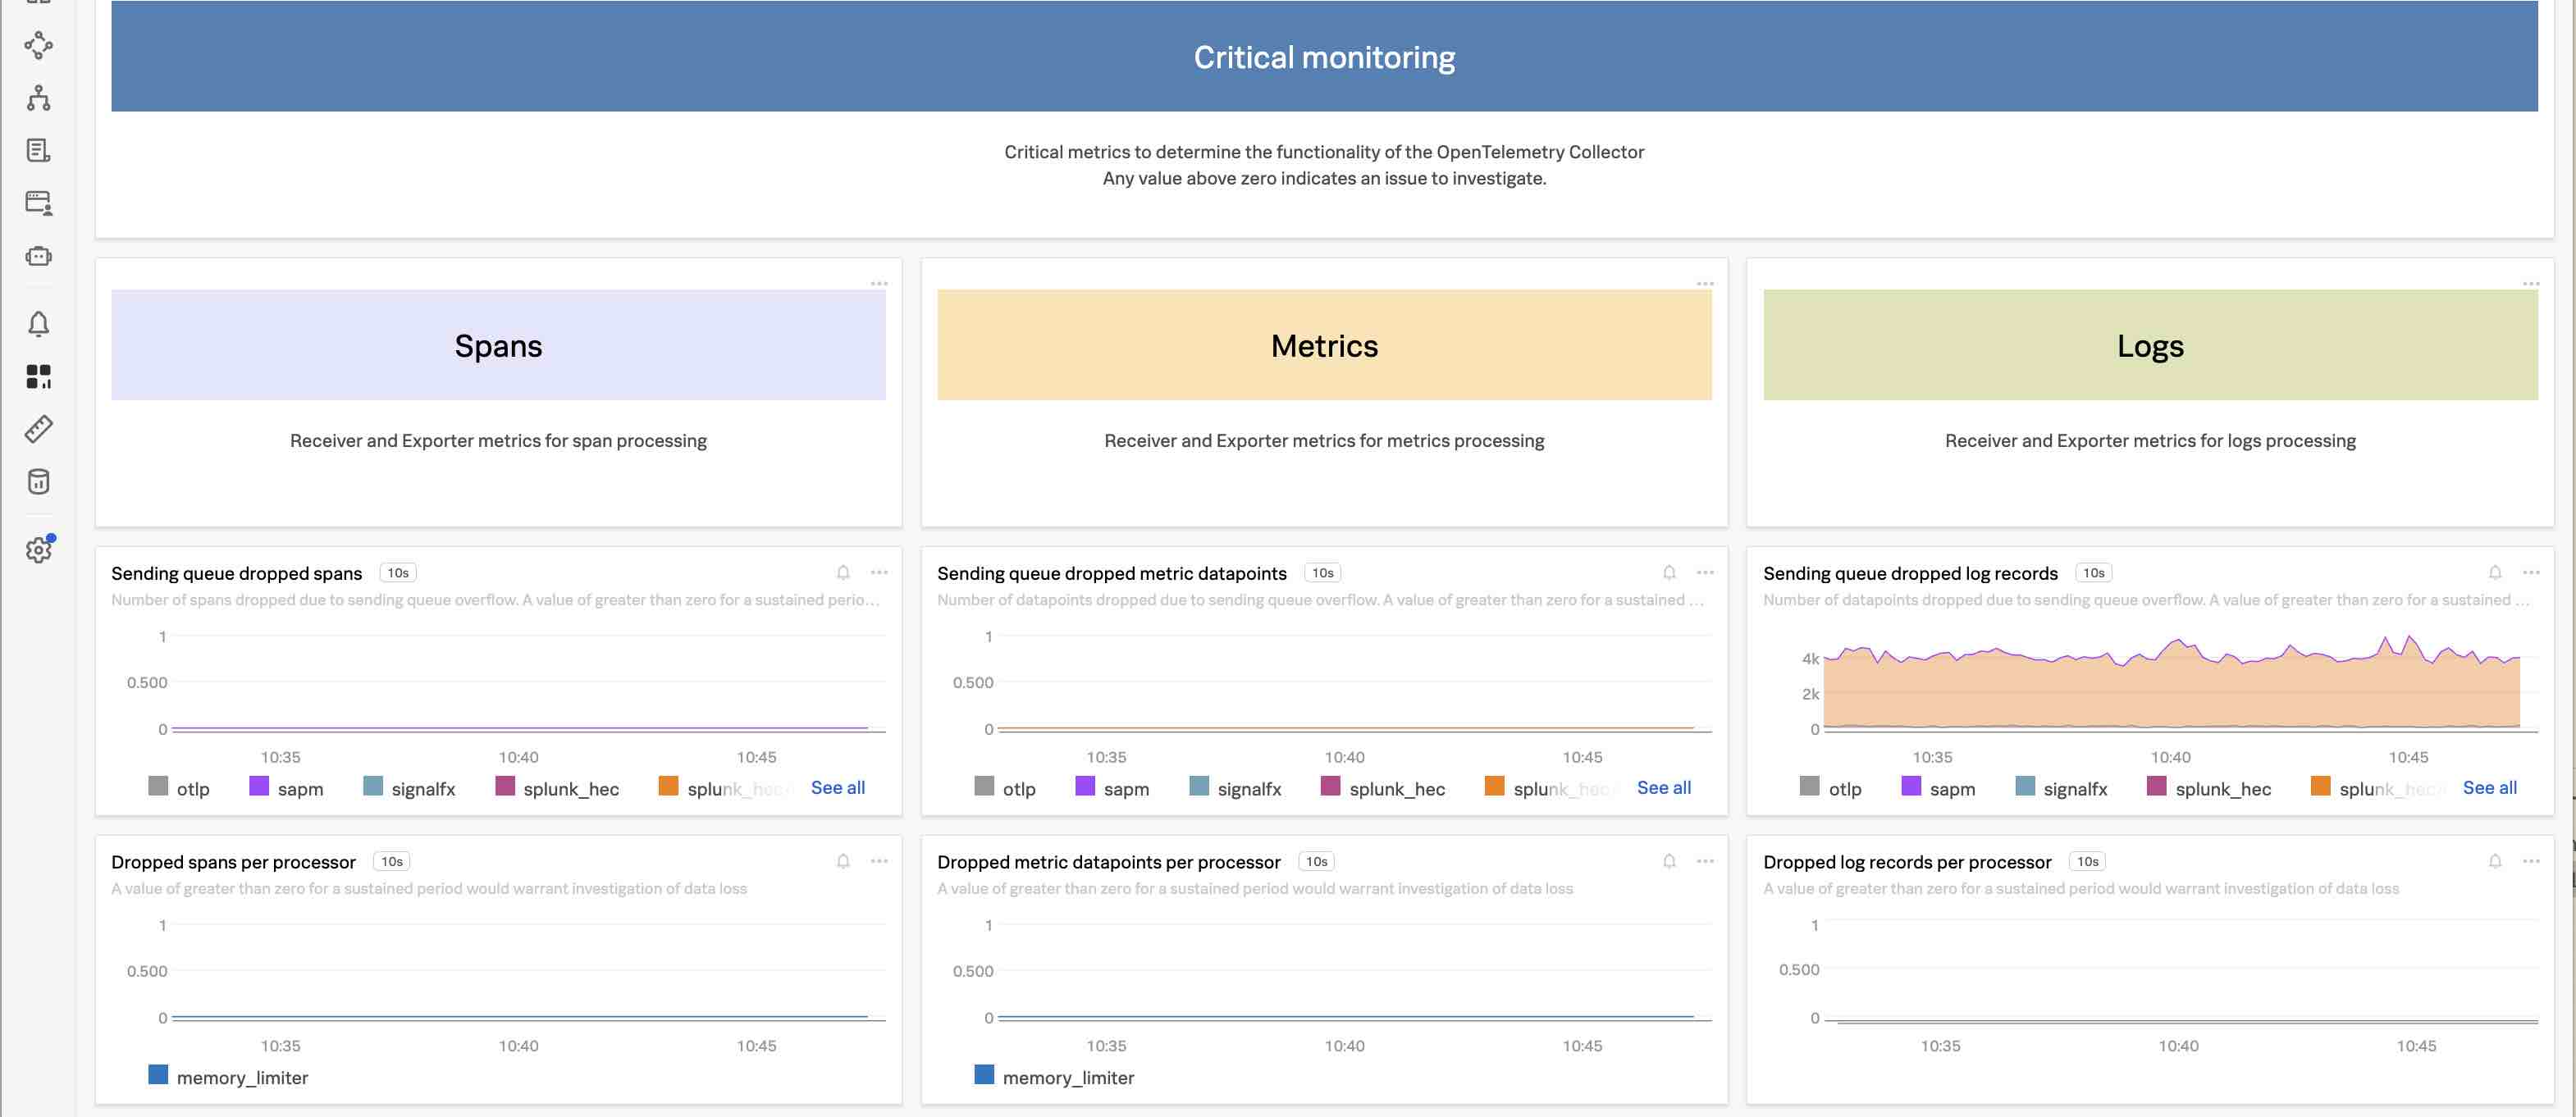
For each processed data type, you’ll find metrics on:
Sending queue dropped spans/metric datapoints/log records
Droppeded spans/metric datapoints/log records per processor
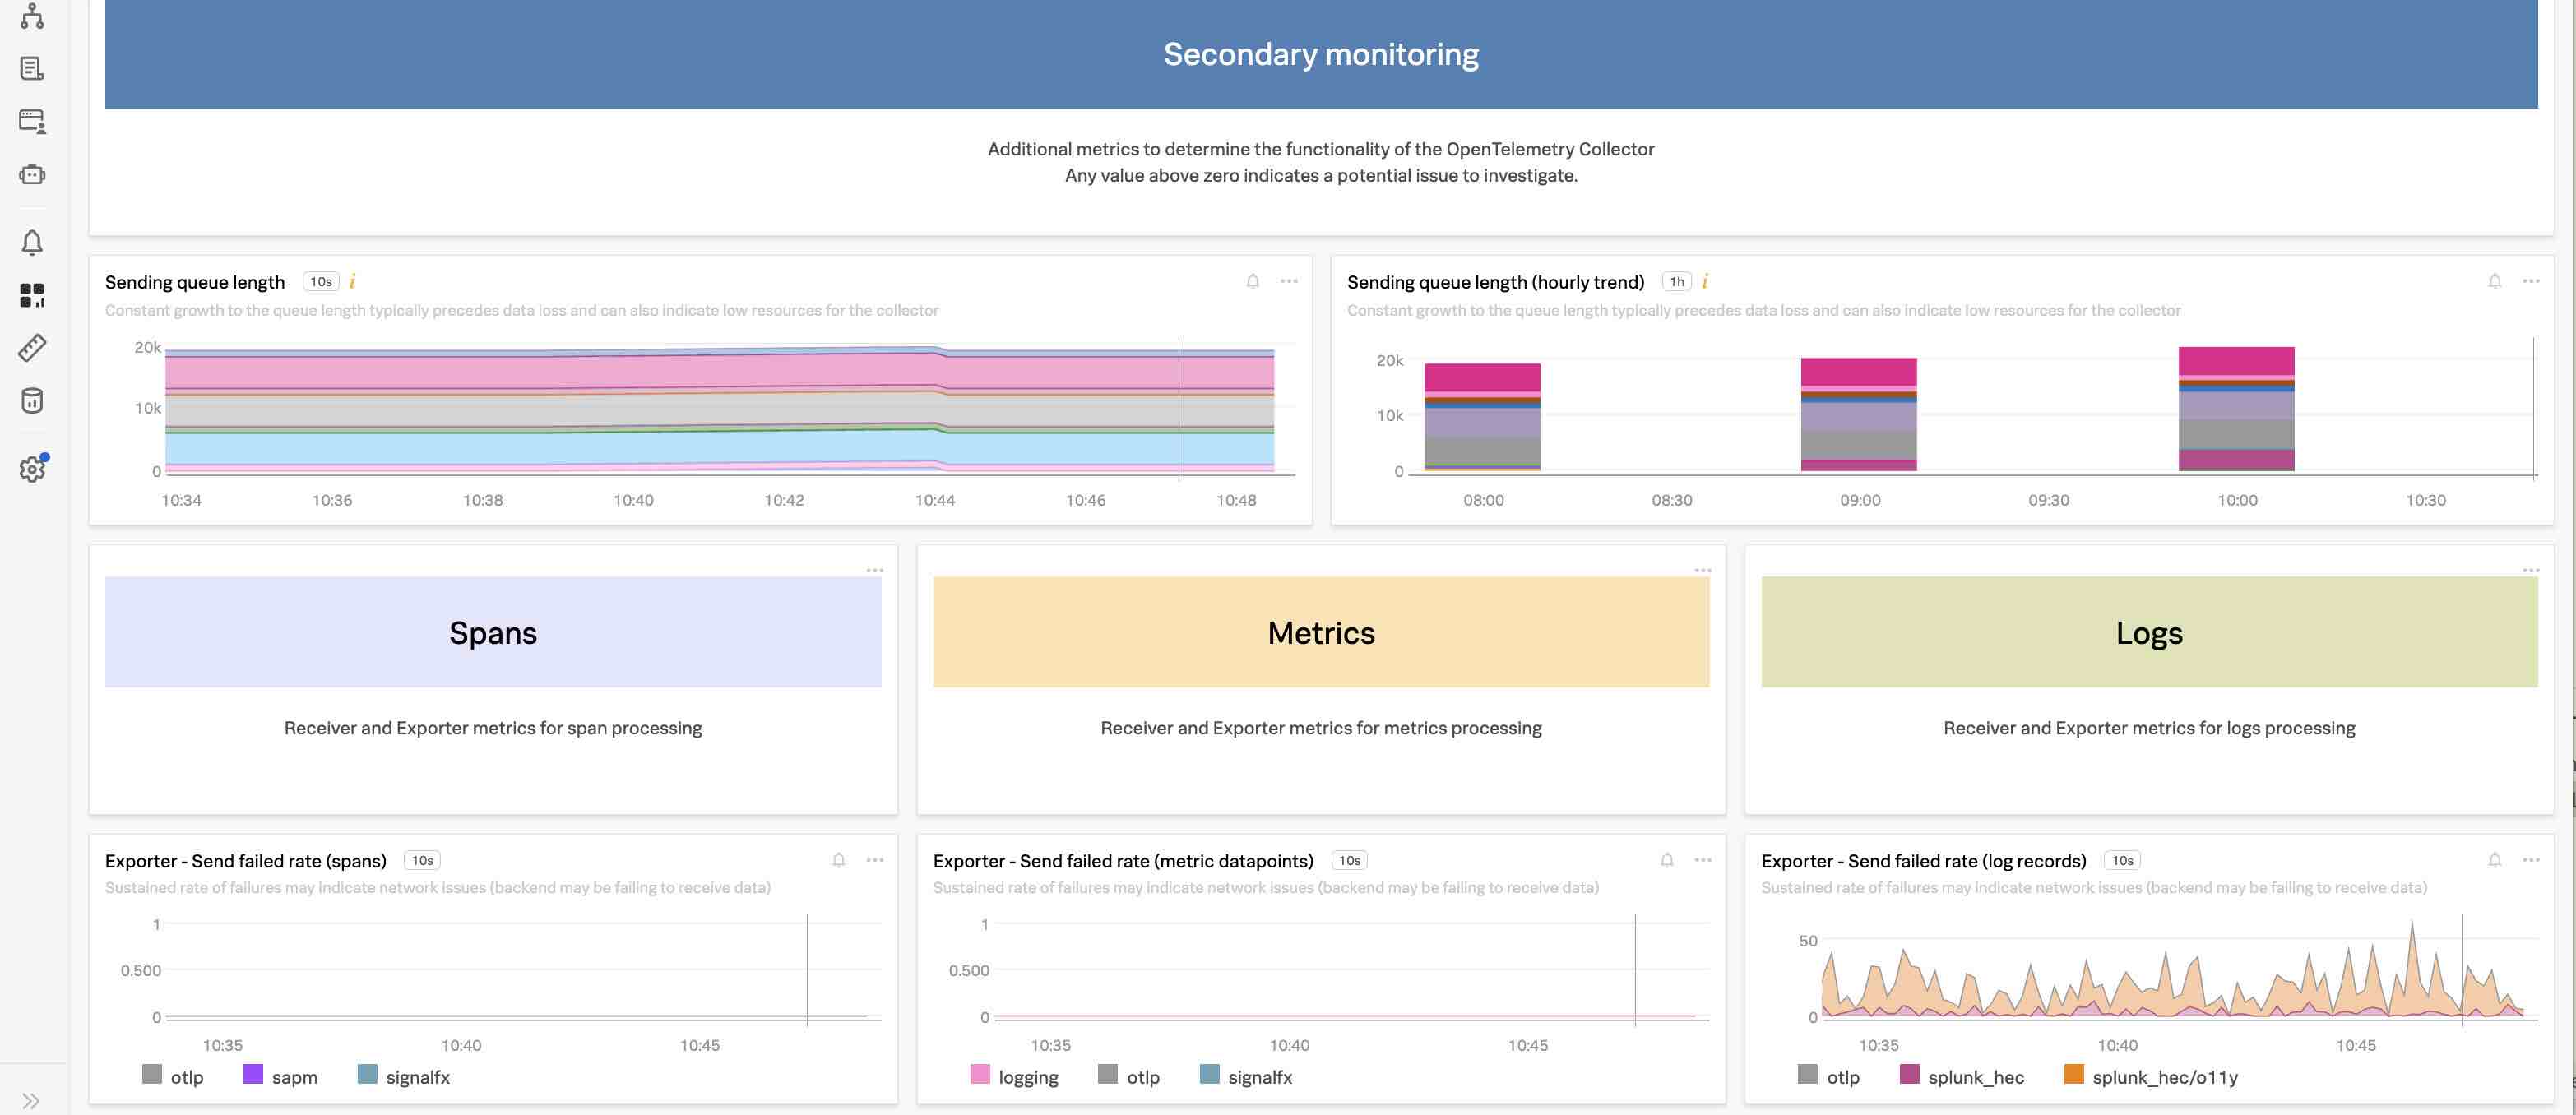
Secondary monitoring 🔗
In this section, you’ll find additional metrics, per processed data type, that can help you monitor and troubleshoot the behavior of your system:
Queue length
Failure rates
Refusal rates
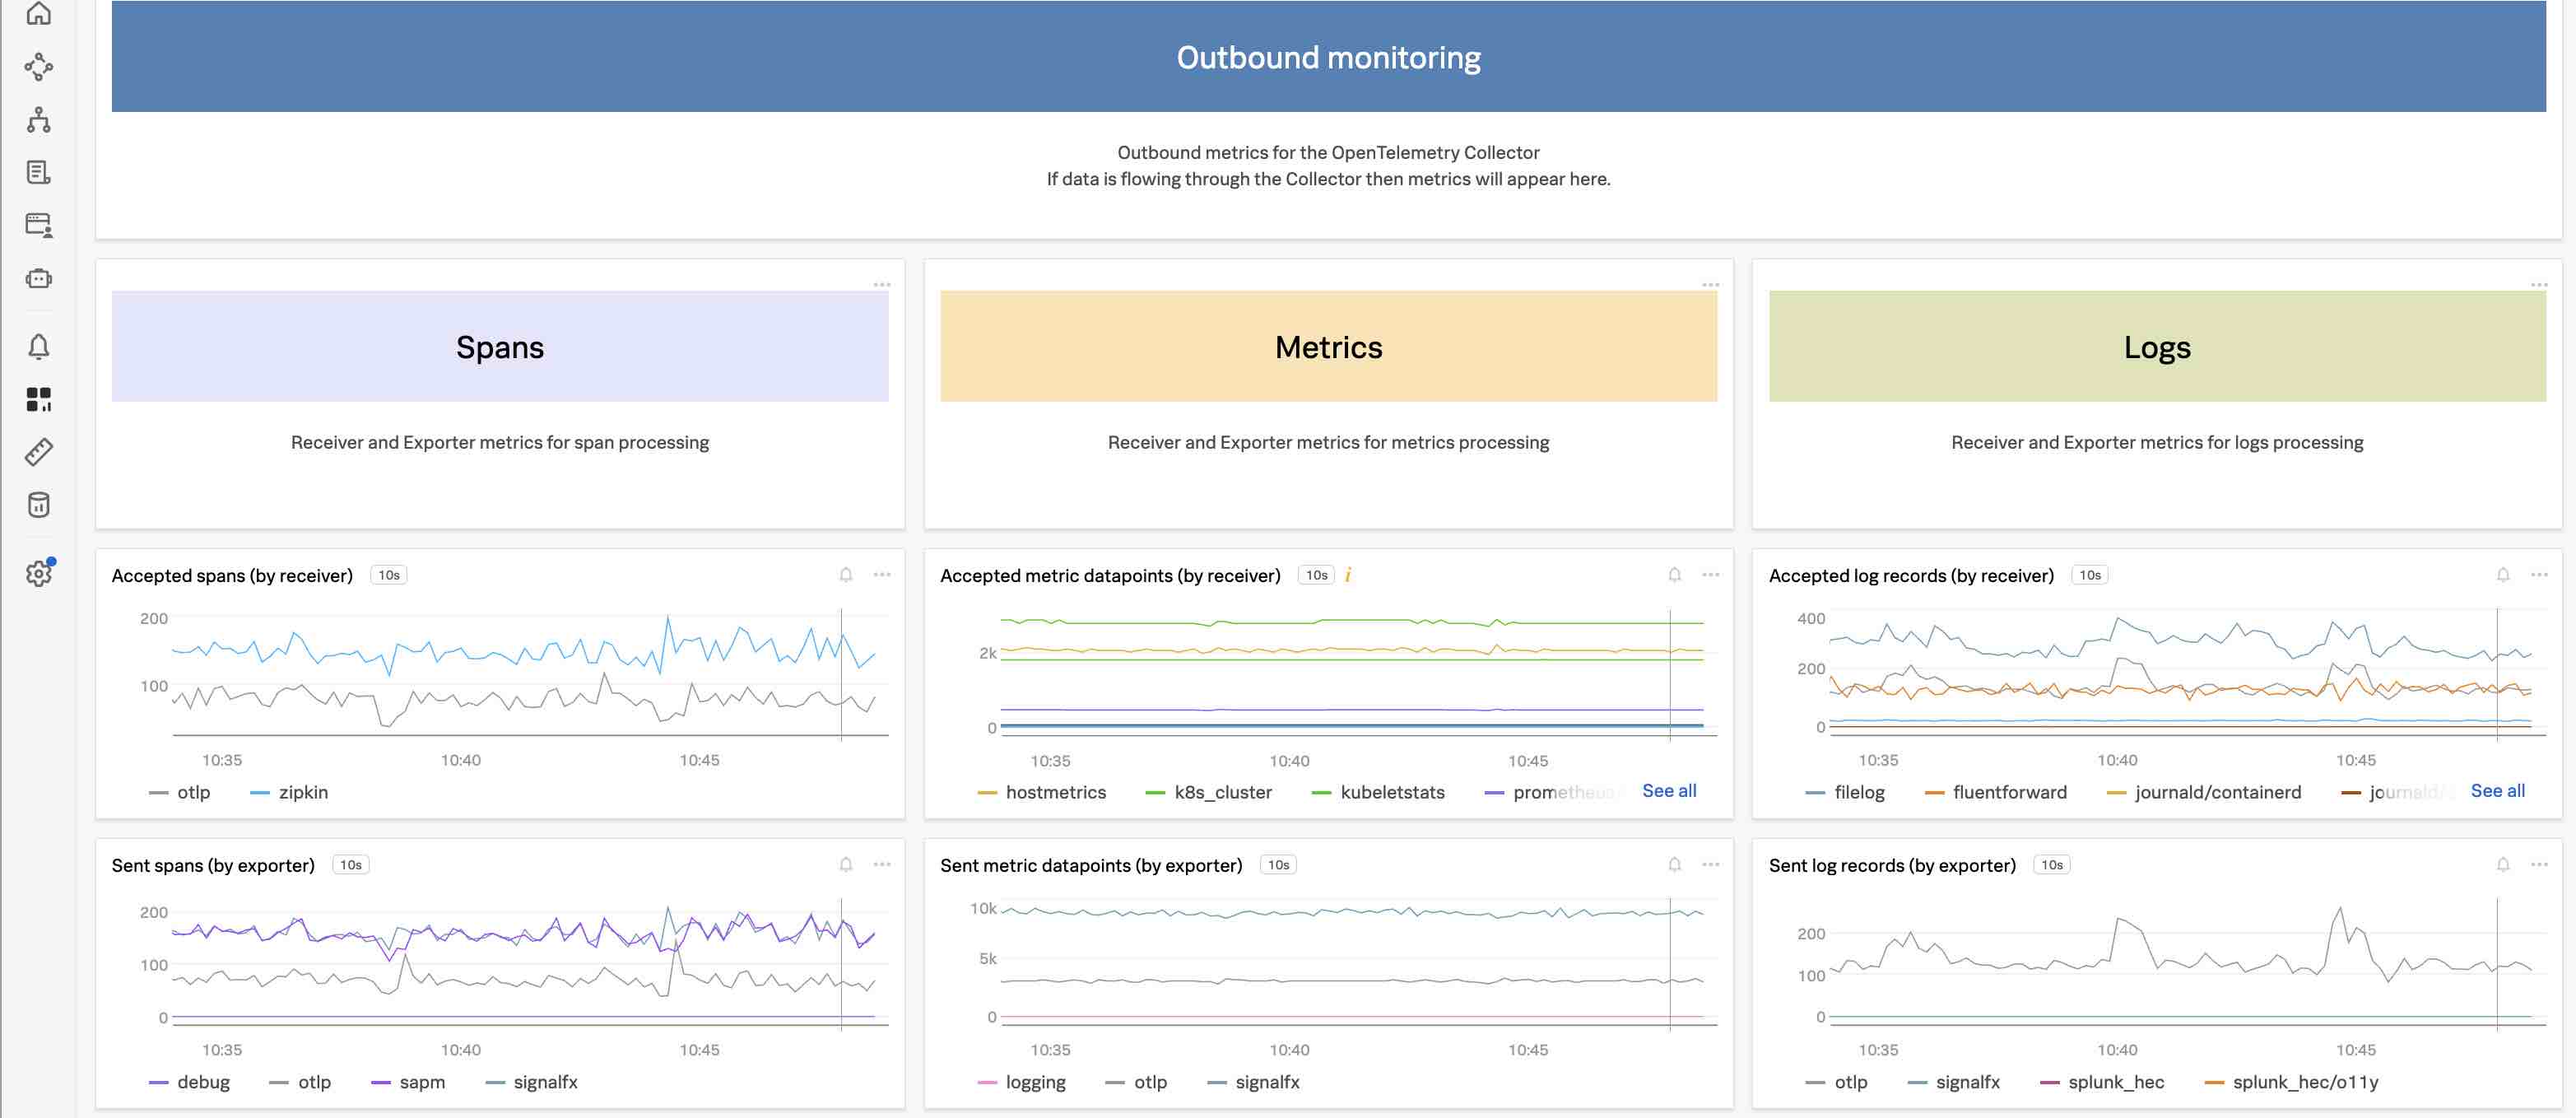
Outbound monitoring 🔗
Finally, Outbound monitoring shows the metrics related to the scale of data flowing through the Collector.