Splunk Observability Cloud overview 🔗
Splunk Observability Cloud provides full-fidelity monitoring and troubleshooting across infrastructure, applications, and user interfaces, in real time and at any scale, to help you:
Keep your services reliable
Deliver great customer experiences
Innovate faster
Select from over 100 supported open standards-based integrations with common data sources to get data from your on-premises and cloud infrastructure, applications and services, and user interfaces into Splunk Observability Cloud.
When you send data from each layer of your full-stack environment to Splunk Observability Cloud, it transforms raw metrics, traces, and logs into actionable insights in the form of dashboards, visualizations, alerts, and more. To learn more about the data model for Splunk Observability Cloud, refer to Data types in Splunk Observability Cloud.
The Splunk Observability Cloud suite of products and features allow you to quickly and intelligently respond to outages and identify root causes, while also giving you the data-driven guidance you need to optimize performance and productivity going forward. Use Splunk Observability Cloud search to quickly locate the service, traceID, dashboard, chart, or metrics-based content you are interested in. For details, see Search in Splunk Observability Cloud.
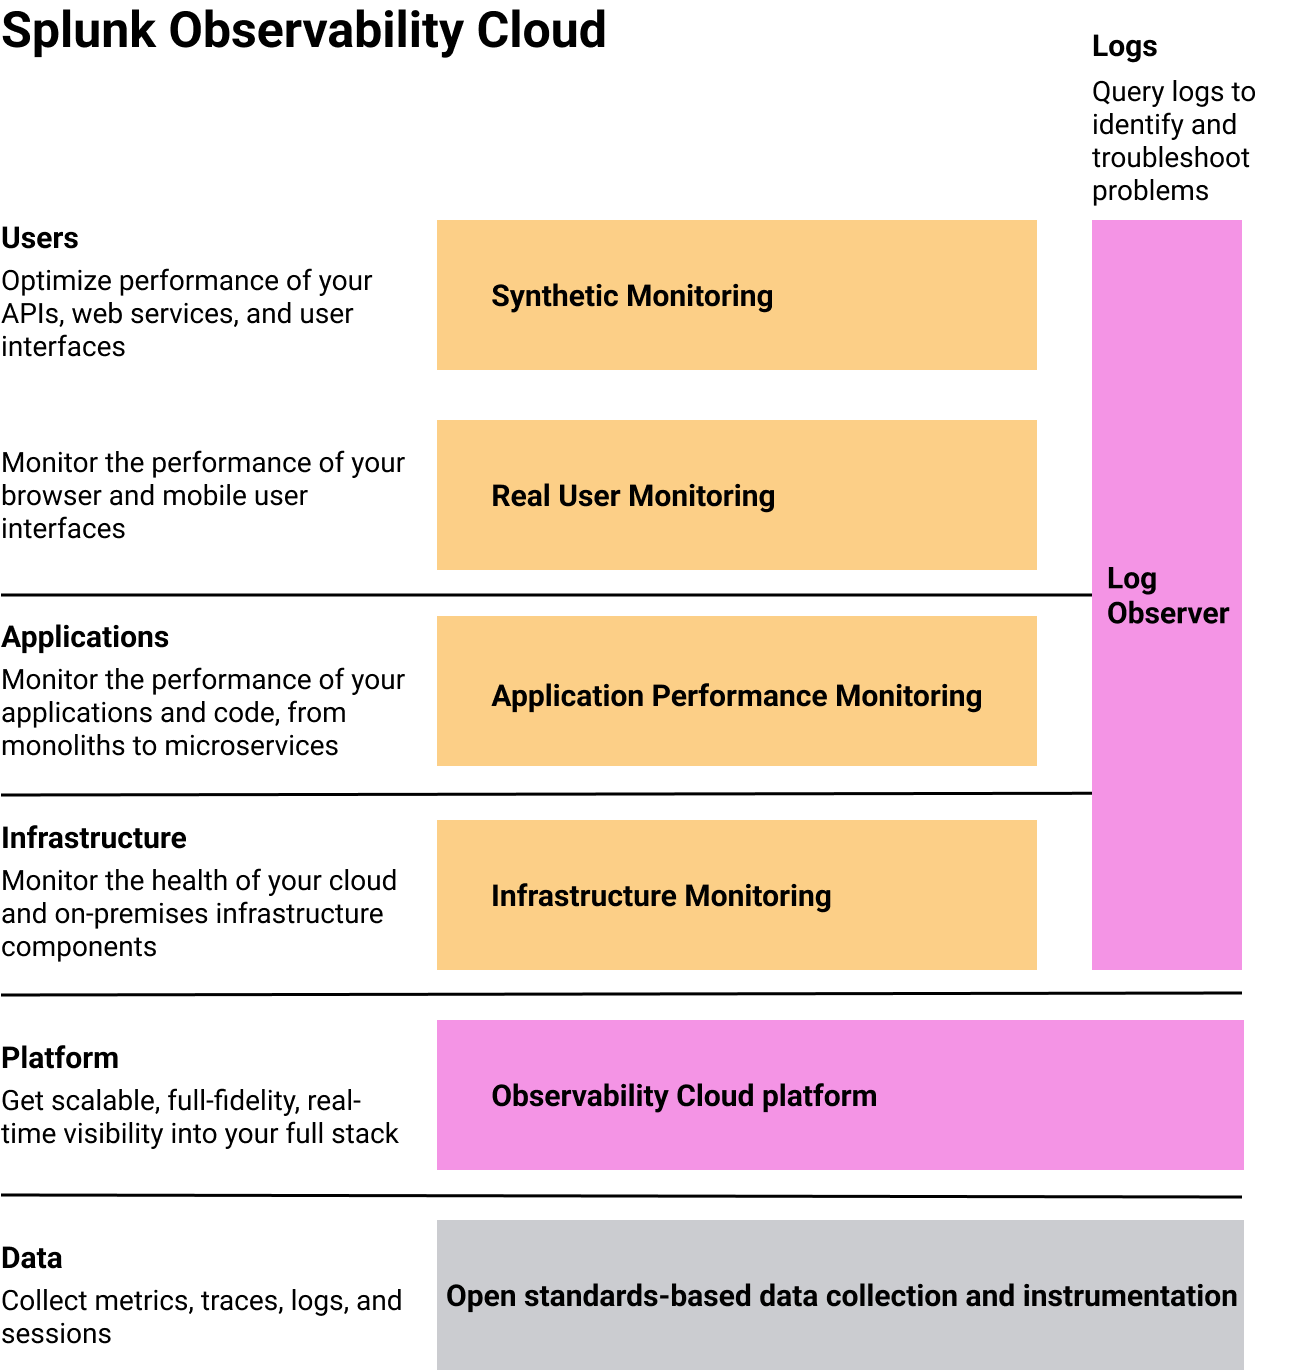
The following diagram provides a high-level view of how each Splunk Observability Cloud product plays its part to provide you with full-stack observability:
For information about how these products can be used together to address real-life scenarios, see Scenario: Kai troubleshoots an issue from the browser to the back end using Splunk Observability Cloud.
For information about Splunk Observability Cloud packaging and pricing, see Pricing - Observability .
Start learning about how the following Splunk Observability Cloud products work to provide you with unified, end-to-end observability of your environment:
Note
For a list of benefits and service terms of Splunk Observability Cloud, see Splunk Observability Cloud service description.
The first step toward full-stack observability is getting data from your environment into Splunk Observability Cloud. Get data in using over 100 supported integrations to common data sources.
For more information about getting data into Splunk Observability Cloud, see Get data into Splunk Observability Cloud.
Gain insights into and perform powerful, capable analytics on your infrastructure and resources across hybrid and multicloud environments with Splunk Infrastructure Monitoring. Infrastructure Monitoring offers support for a broad range of integrations for collecting all kinds of data, from system metrics for infrastructure components to custom data from your applications.
For more information, see What can I do with Splunk Infrastructure Monitoring?
Collect traces and spans to monitor your distributed applications with Splunk APM. A trace is a collection of actions, or spans, that occur to complete a transaction. Splunk APM collects and analyzes every span and trace from each of the services that you have connected to Splunk Observability Cloud to give you full-fidelity access to all of your application data.
For more information, see Introduction to Splunk APM
For information about how APM can be used to address real-life scenarios, see Scenarios for troubleshooting errors and monitoring application performance using Splunk APM.
Splunk Real User Monitoring provides insights about the performance and health of the front-end user experience of your application. Splunk RUM collects performance metrics, web vitals, errors, and other forms of data to allow you to detect and troubleshoot problems in your application, measure the health of your application, and assess the performance of your user experience.
For more information, see Introduction to Splunk RUM.
Splunk Synthetics Monitoring is a platform to synthetically measure performance of your web-based properties. It offers features that provide insights that allow you to optimize uptime and performance of APIs, service endpoints, and end user experiences and prevent web performance issues.
For more information, see the Introduction to Splunk Synthetic Monitoring.
Troubleshoot your application and infrastructure behavior using high-context logs in Splunk Observability Cloud. With Splunk Log Observer Connect, you can perform codeless queries on logs to detect the source of problems in your systems.
For more information, see Introduction to Splunk Log Observer Connect.
Splunk On-Call incident response software aligns log management, monitoring, chat tools, and more, for a single-pane of glass into system health. Splunk On-Call automates delivery of alerts to get the right alert, to the right person, at the right time.
For more information, see the How to get started with Splunk On-Call.
Splunk Observability Cloud for Mobile is an iOS and Android companion mobile app to Splunk Observability Cloud. You can use Splunk Observability Cloud for Mobile to check system critical metrics in Splunk Observability Cloud on the go, access real-time alerts with visualizations, and view mobile-friendly dashboards.
For more information, see Introduction to Splunk Observability Cloud for Mobile.
Splunk IT Essentials Work (ITE Work) is a free application that helps you get started with monitoring and analyzing your IT infrastructure.
Splunk IT Service Intelligence (ITSI) is a premium IT operations solution that provides actionable insight into the performance and behavior of your IT services. You can also ingest events from across your IT landscape and from other monitoring silos to provide a unified operational console of all your events and service-impacting issues.
For more information about these applications, see the IT operations product overview .
Quickly set up your IT Service Intelligence (ITSI) or IT Essentials Work (ITE Work) environment using prepackaged content such as KPI base searches, service templates, saved glass tables, and other knowledge objects.
For more information, see the Overview of the Splunk App for Content Packs .
For information about how these products can be used together to address real-life scenarios, see Scenario: Kai troubleshoots an issue from the browser to the back end using Splunk Observability Cloud.
For information about Splunk Observability Cloud packaging and pricing, see Pricing - Observability .