Built-in dashboards 🔗
Splunk Observability Cloud provides built-in dashboards that give you immediate visibility into the technologies and services being used in your environment.
Built-in dashboards and the charts they contain are read-only. They are automatically created in your organization when you deploy any of the supported integrations, and they appear in:
The Built-In Dashboard Groups section of the Dashboards page.
The Dashboard section of the navigators in Infrastructure Monitoring.
Built-in dashboards are optimized for monitoring populations as well as individual nodes. For each technology or service, Splunk Observability Cloud uses aggregations, percentiles, or Top N analytics functions to let you see patterns and identify outliers, and also provide individual metrics for insight into the functioning of single nodes.
Clone a built-in dashboard 🔗
Built-in dashboards are read‑only, so you can’t directly save filters or time ranges to the dashboard, or make any changes to the charts on the dashboard. You need to clone the original dashboard and modify the cloned dashboard.
In a navigator 🔗
To clone a built-in dashboard in a navigator, follow these steps:
Select Infrastructure from the Splunk Observability Cloud home page.
On the Infrastructure Monitoring landing page, select the navigator that contains the dashboard you want to clone.
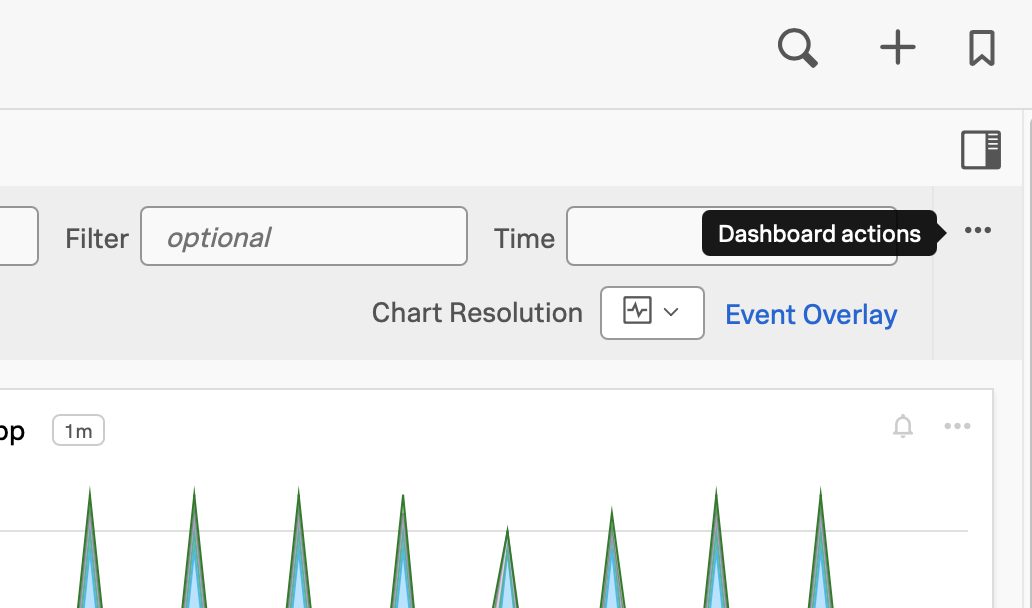
In the Dashboard section, click the Dashboard actions menu.
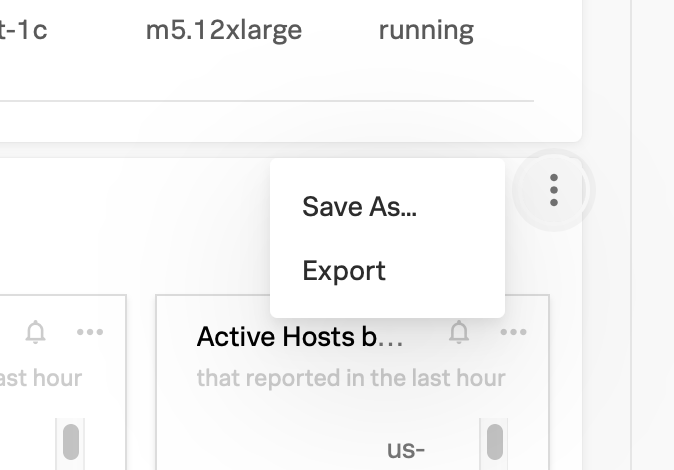
Select Save As….
In the Dashboard Name field, specify a name for the cloned dashboard. Use a different name from the original dashboard to avoid multiple dashboards with the same name.
From the Dashboard Permissions drop-down menu, configure permission settings for the cloned dashboard.
From the Dashboard Group menu, find and select a dashboard group to save the cloned dashboard.
From the Dashboards page 🔗
To clone a built-in dashboard from the Dashboards page, follow these steps:
Select Dashboards from the Splunk Observability Cloud home page.
In the Built-in Dashboard Groups section, expand the dashboard group that contains the dashboard you want to clone.
Select the dashboard you want to clone.
Click the Dashboard actions menu.
Select Save As….
In the Dashboard Name field, specify a name for the cloned dashboard. Use a different name from the original dashboard to avoid multiple dashboards with the same name.
From the Dashboard Permissions drop-down menu, configure permission settings for the cloned dashboard.
From the Dashboard Group menu, find and select a dashboard group to save the cloned dashboard.
Note
You can save a cloned dashboard to an existing custom or user dashboard group, or you can create a new dashboard group. If you create a new group, the group is added as a Custom Dashboard group.
To learn more about dashboard permissions, see Read and write permissions in Splunk Infrastructure Monitoring.
Export a built-in dashboard 🔗
In a navigator 🔗
To export a dashboard in a navigator, follow these steps:
Select Infrastructure from the Splunk Observability Cloud home page.
On the Infrastructure Monitoring landing page, select the navigator that contains the dashboard you want to export.
In the Dashboard section, click the Dashboard actions menu.
Select Export.
Click Download.
From the Dashboards page 🔗
To clone a built-in dashboard from the Dashboards page, follow these steps:
Select Dashboards from the Splunk Observability Cloud home page.
In the Built-in Dashboard Groups section, expand the dashboard group that contains the dashboard you want to export.
Select the dashboard you want to export.
Click the Dashboard actions menu.
Select Export.
Click Download.
Clone a chart in a built-in dashboard to make changes 🔗
To clone a chart in a built-in dashboard, follow these steps:
Click the name of the chart you want to clone on the built-in dashboard. The chart opens in the Chart Builder view.
Make any changes you want in the Chart Builder view.
Click Save As to save the cloned chart to another dashboard of your choice.
Filter built-in dashboards 🔗
In addition, you can use dimensions or properties to filter built-in dashboards and hone in on a specific slice of your environment. You can also use the Time Range selector to specify the time range for which you want to view the metrics. See Time range in Specify settings for all charts in a dashboard.