Automatic discovery of apps and services 🔗
The Splunk Distribution of the OpenTelemetry Collector can automatically identify data sources and collect metrics and traces to send them to Splunk Observability Cloud. With automatic discovery and zero-code instrumentation you don’t need to manually configure the Splunk Distribution of the OpenTelemetry Collector or your applications before deploying them.
The following diagram shows how automatic discovery finds data sources:
Automatic discovery detects and collects signal data from third-party services, such as databases and web servers. Through auto discovery the Collector automatically generates a configuration snipet that you can modify and incorporate into your existing configuration to retrieve your services’ data.
Caution
Auto discovery of third-party services is only available for the Collector in Linux and Kubernetes environments.
Via automatic discovery you can also enable zero-code instrumentation of back-end applications, which allows the Collector to retrieve data from application language runtimes without having to modify the source application code or adding any new installation or configuration steps. With this option you won’t have to install and configure your instrumentation agents separately. Zero-code instrumentation using the Collector’s automatic discovery feature is only available for the Java, Node.js, and .NET language runtimes. Alternatively you can deploy zero-code instrumentation independently from the Collector for 8 back-end languages, as described in Instrument back-end applications to send spans to Splunk APM.
Supported host services and applications for automatic discovery
Automatic discovery of third-party applications is supported in Linux and Kubernetes environments for the following services:
Service |
Receiver |
|---|---|
Apache Web Server |
Apache Web Server receiver. See Apache Web Server receiver. |
MySQL |
MySQL receiver. See MySQL receiver |
PostgreSQL |
PostgreSQL receiver. See PostgreSQL receiver |
OracleDB |
Oracle DB receiver. See Oracle Database receiver |
NGINX |
NGINX receiver. See NGINX receiver |
RabbitMQ |
RabbitMQ receiver. See RabbitMQ receiver. |
Redis |
Redis receiver. See Redis receiver |
MongoDB |
MongoDB receiver. See MongoDB receiver |
Kafka |
Kafka metrics receiver. See Kafka metrics receiver |
Microsoft SQL Server |
Microsoft SQL Server receiver. See Microsoft SQL server receiver |
Read more:
Linux: Automatic discovery for third-party services in Linux
Kubernetes: Automatic discovery for third-party services in Kubernetes
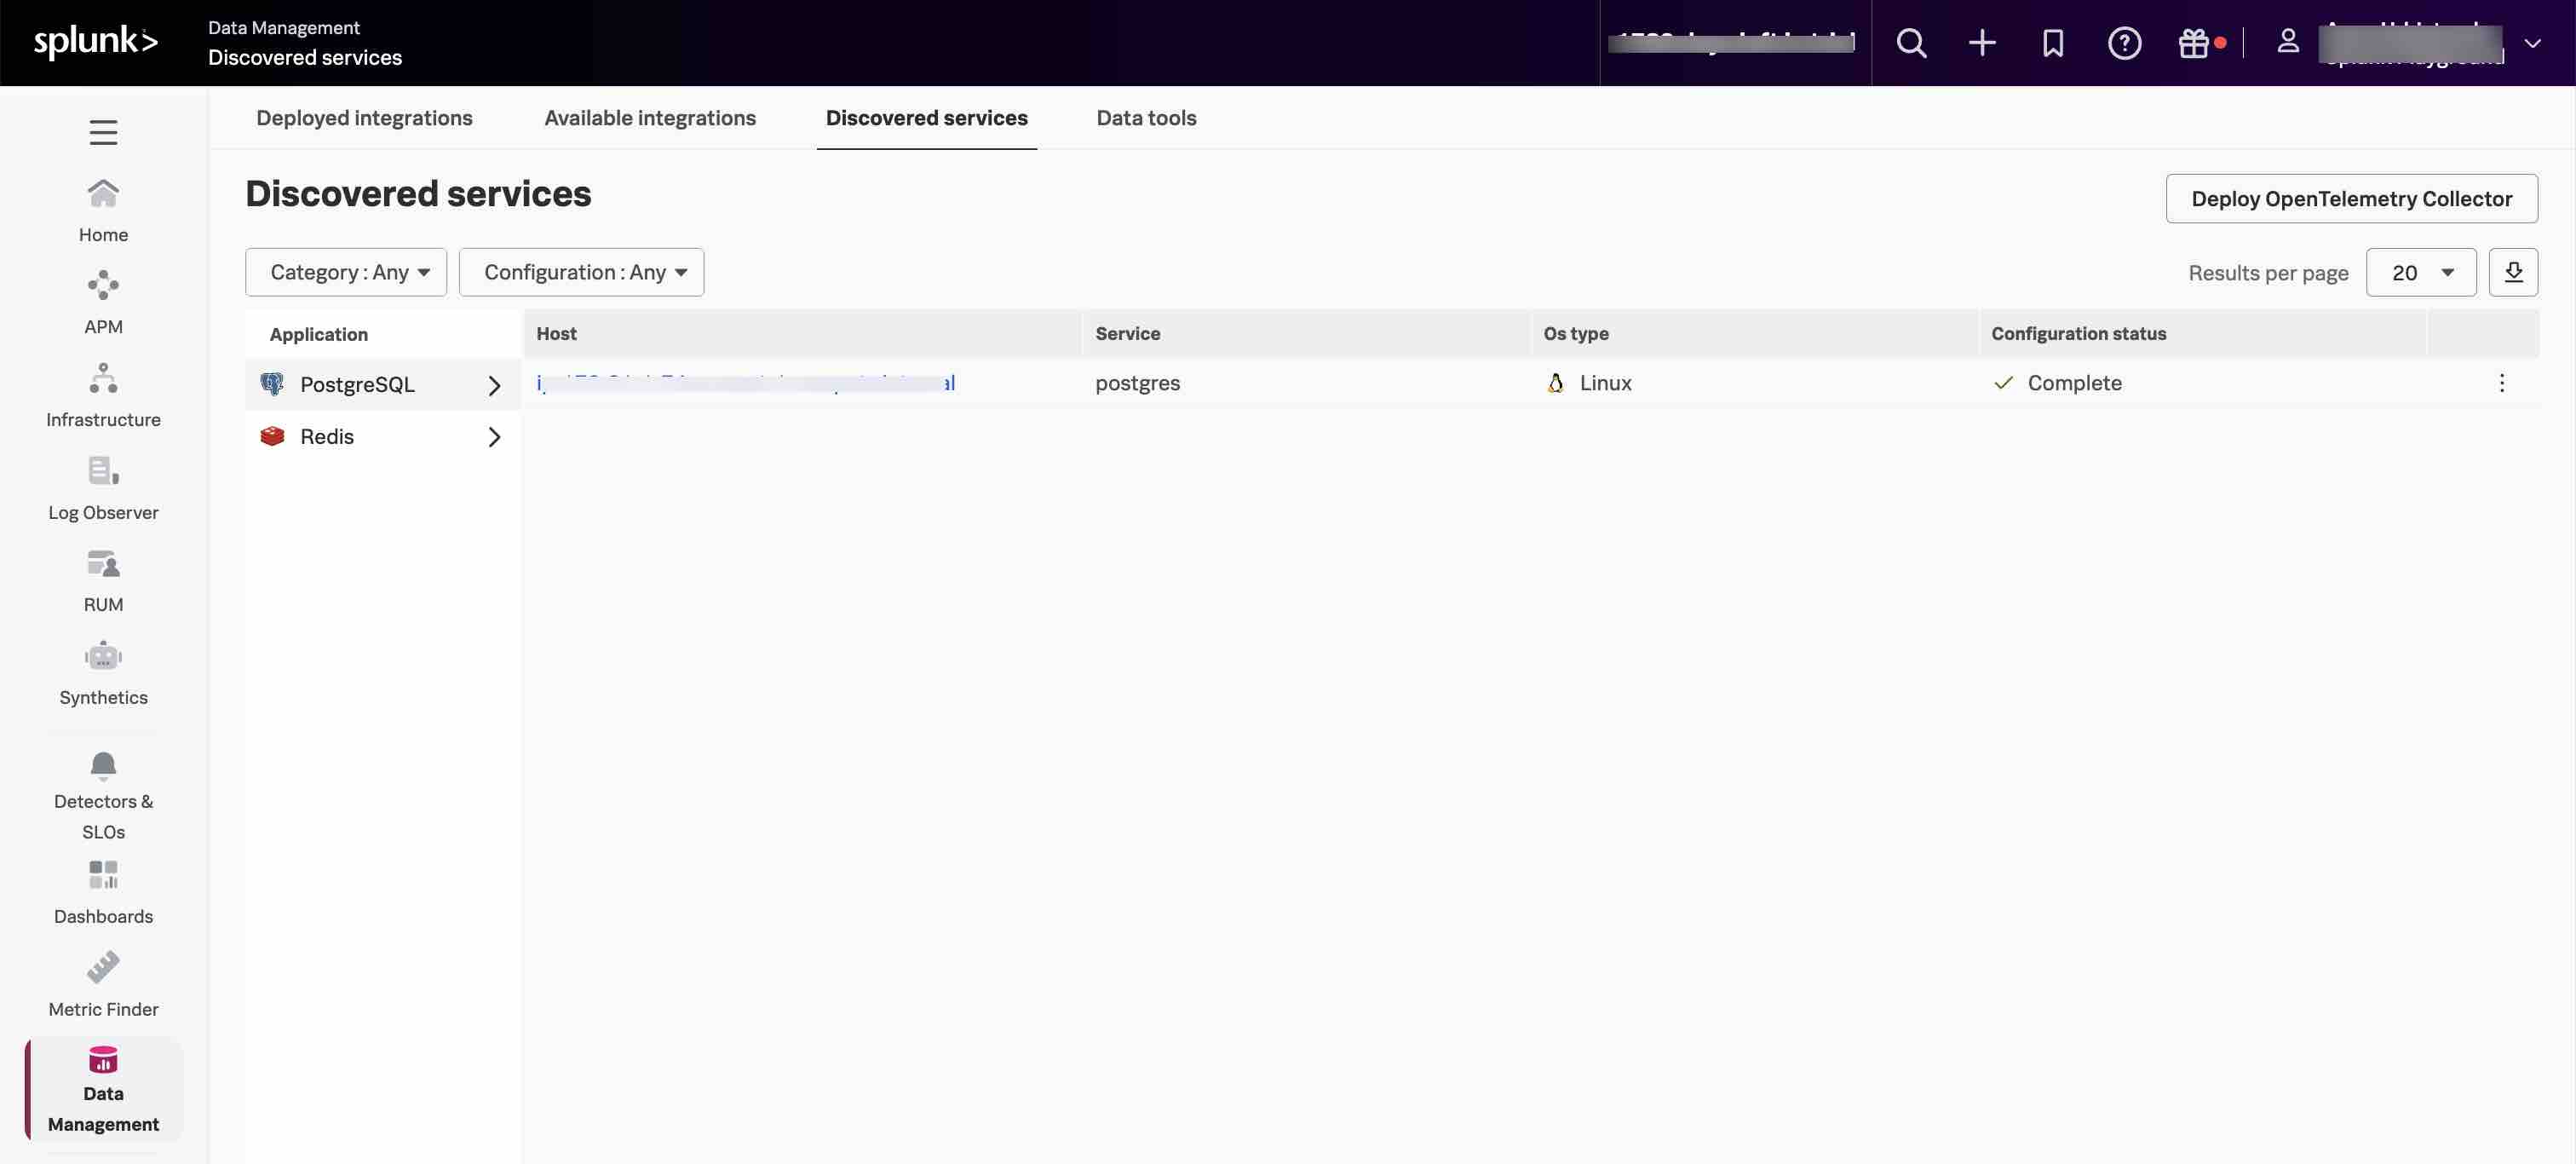
Discovered services in the UI
If you’re in a Kubernetes environment and are using the Collector version 0.109.0 or higher, log in to Splunk Observability Cloud and go to the Discovered services tab in the Data Management menu to see which of your services and third-party applications the Collector has detected and can monitor automatically.
Supported language runtimes for zero-code instrumentation
Zero-code instrumentation via the Collector’s automatic discovery is available for the following languages:
Application language |
Supported for Linux |
Supported for Windows |
Supported for Kubernetes |
|---|---|---|---|
Java |
Yes. See Zero-code instrumentation for back-end applications in Linux |
No |
Yes. See Zero-code instrumentation for back-end applications in Kubernetes |
.NET |
Yes. See Zero-code instrumentation for back-end applications in Linux |
Yes. See Zero-code instrumentation for back-end applications in Windows |
Yes. See Zero-code instrumentation for back-end applications in Kubernetes |
Node.js |
Yes. See Zero-code instrumentation for back-end applications in Linux |
No |
Yes. See Zero-code instrumentation for back-end applications in Kubernetes |