Related Content in Splunk Observability Cloud 🔗
The Related Content panel automatically correlates and presents data between different views within Splunk Observability Cloud. In one view of Splunk Observability Cloud, such as APM, the Related Content bar shows and links to related content in other views.
Splunk Cloud Platform also has the Related Content panel where users can see previews of observability data that correlates to search results in the Search app. For more information, see Preview Splunk Observability Cloud data .
Use Related Content 🔗
Select tiles in the Related Content bar to seamlessly navigate from one view to another in Splunk Observability Cloud. The following animation shows a user navigating from APM to Infrastructure Monitoring to Log Observer.
In the preceding example, the user navigates through the following sequence:
The user starts in APM by exploring the service dependency map. They select the Frontend service because it shows a high error rate.
In the Related Content bar at the bottom of the screen, the user sees an Infrastructure tile showing related EC2 instances and selects it. Results are grouped by component. For example, Infrastructure, Logs, APM. Hovering over the tile indicates whether there are any Related Content results to view.
Splunk Observability Cloud takes the user to Infrastructure where they select the first EC2 instance because it shows the highest CPU utilization.
In the Related Content bar, the user sees a tile showing logs related to the EC2 instance, so they click it.
Splunk Observability Cloud takes the user to Log Observer where they can drill down into the related logs to find the root cause of the problem.
Note
Related Content is different from data links, a separate capability, which lets you dynamically transfer contextual information about the property you’re viewing to the resource, helping you get to relevant information faster. To learn more about data links, see Link APM services, traces, and spans to relevant resources.
Required Collector components 🔗
If you’re using the Splunk Distribution of the OpenTelemetry Collector, any other distribution of the Collector, or the upstream Collector and want to ensure Related Content in Splunk Observability Cloud behaves correctly, verify that the SignalFx exporter is included in your configuration. This exporter aggregates the metrics from the hostmetrics receiver and must be enabled for the metrics and traces pipelines.
The Collector uses the correlation flag of the SignalFx exporter to make relevant API calls to correlate your spans with the infrastructure metrics. This flag is enabled by default. To adjust the correlation option further, see the SignalFx exporter’s options at Settings.
Required metadata fields 🔗
Related Content relies on specific metadata that allow APM, Infrastructure Monitoring, and Log Observer to pass filters around Splunk Observability Cloud.
The following sections list the metadata key names required to enable Related Content for each view in Splunk Observability Cloud. If your data does not have the field names listed here, Splunk Observability Cloud cannot correlate your related data.
Splunk APM 🔗
To enable Related Content for APM use one of these span tags:
service.nametrace_id
Optionally, you can also use deployment.environment with service.name.
The default configuration of the Splunk Distribution of the OpenTelemetry Collector already provides these span tags. To ensure full functionality of Related Content, do not change any of the metadata key names or span tags provided by the Splunk OTel Collector.
Learn more:
About span tags in Splunk APM, see Manage services, spans, and traces in Splunk APM.
About deployment environments in Splunk APM, see Set up deployment environments in Splunk APM.
Leverage Related Content for APM and pod-specific Kubernetes data 🔗
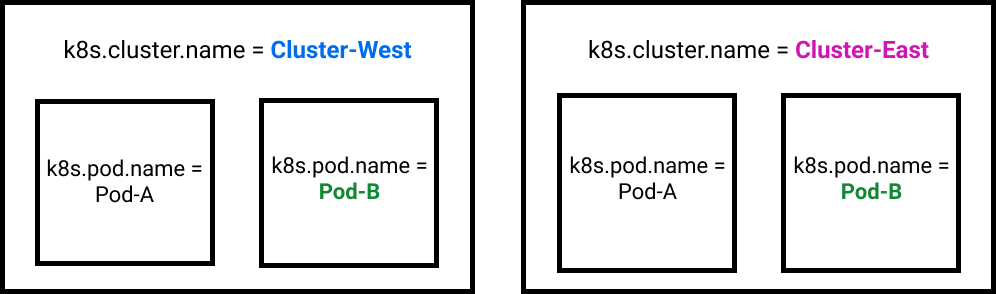
For a Related Content tile in APM to link to data for a specific Kubernetes pod (k8s.pod.name), you must first filter on a specific Kubernetes cluster (k8s.cluster.name). APM cannot guarantee an accurate Related Content Kubernetes pod destination in Infrastructure Monitoring without both values because Kubernetes pod names are not required to be unique across clusters.
For example, consider a scenario in which Related Content needs to return data for a Kubernetes pod named Pod-B. As shown the following diagram, a Kubernetes implementation can have multiple pods with the same name. For Related Content to return the data for the correct Pod-B, you must also provide the name of the Kubernetes cluster the pod resides in. In this case, that name would be either Cluster-West or Cluster-East. This combination of filtering on cluster and pod names creates the unique combination that Related Content needs to link to the correct pod data in Infrastructure Monitoring.
Splunk Infrastructure Monitoring 🔗
To enable Related Content for IM use one of these metadata combinations:
host.name. It falls back onhost,aws_private_dns_name(AWS),instance_name(GCP),azure_computer_name(Azure)k8s.cluster.namek8s.cluster.name+k8s.node.namek8s.cluster.name+k8s.node.name(optional) +k8s.pod.namek8s.cluster.name+k8s.node.name(optional) +k8s.pod.name(optional) +container.idservice.nameservice.name+deployment.environment(optional) +k8s.cluster.name(optional)
If you’re using the default configuration of the Splunk Distribution of the OpenTelemetry Collector for Kubernetes, the required Infrastructure Monitoring metadata is provided. See more at Install the Collector for Kubernetes using Helm.
If you’re using other distributions of the OpenTelemetry Collector or non-default configurations of the Splunk Distribution to collect infrastructure data, Related Content won’t work out of the box.
Splunk logs 🔗
To enable Related Content for logs use one of these fields:
host.nameservice.namespan_idtrace_id
To ensure full functionality of both Log Observer and Related Content, verify that your log events fields are correctly mapped. Correct log field mappings enable built-in log filtering, embed logs in APM and Infrastructure Monitoring functionality, and enable fast searches as well as the Related Content bar.
If the key names in the preceding list use different names in your log fields, remap them to the key names listed here. For example, if you don’t see values for host.name in the Log Observer UI, check to see whether your logs use a different field name, such as host_name. If your logs do not contain the default field names exactly as they appear in the preceding list, remap your logs using one of the methods in the following section.
Note
Customers with a Splunk Log Observer entitlement in Splunk Observability Cloud must transition from Log Observer to Log Observer Connect by December 2023. With Log Observer Connect, you can ingest more logs from a wider variety of data sources, enjoy a more advanced logs pipeline, and expand into security logging. See Accomplish logs pipeline rules in Splunk platform to learn how.
Kubernetes log fields 🔗
The Splunk Distribution of the OpenTelemetry Collector injects the following fields into your Kubernetes logs. Do not modify them if you want to use Related Content.
k8s.cluster.namek8s.node.namek8s.pod.namecontainer.idk8s.namespace.namekubernetes.workload.name
Use one of these tag combinations to enable Related Content:
k8s.cluster.name+k8s.node.namek8s.cluster.name+k8s.node.name(optional) +k8s.pod.namek8s.cluster.name+k8s.node.name(optional) +k8s.pod.name(optional) +container.id
Learn more about the Collector for Kubernetes at Get started with the Collector for Kubernetes.
Remap log fields 🔗
The following table describes the four methods for remapping log fields:
Remapping Method |
Instructions |
|---|---|
Log Field Aliasing |
Create and activate a field alias. See Create field aliases to learn how. Learn when to use Log Field Aliasing in the next section. |
Client-side |
Configure your app to remap the necessary fields. |
When to use Log Field Aliasing 🔗
Use Log Field Aliasing to remap fields in Splunk Observability Cloud when you cannot or do not want to create a copy processor because any of the following are true:
You use Log Observer Connect to get logs data and do not have access to Log Observer Pipeline Management.
You do not want to use indexing capacity by creating additional log processing rules.
You do not want to transform your data at index time.
You want the new alias to affect every log message, even those that came in from a time before you created the alias.
How to change your metadata key names 🔗
Change metric and traces names 🔗
Use the Splunk Distribution of the OpenTelemetry Collector to ensure that your metrics and traces have the metadata key names required to use Splunk Observability Cloud’s Related Content feature. If you did not use the Collector and your metrics or traces do not include the required metadata key names, you can instrument your applications and serverless functions to include them. See the following pages to learn how:
Change log names 🔗
If the required key names use different names in your log fields, remap them using one of the methods listed in Remap log fields.