Search the Metric Finder and Metadata Catalog 🔗
Search the Metric Finder to find, view, and edit metrics and metadata in your applications.
Search for metrics in the Metric Finder 🔗
In the Metric Finder, search using whatever information you know. For example, you can search by:
Name of the metric, or part of the name.
Metadata like dimensions, properties, and tags that are relevant to your target metric.
Value of a dimension or property associated with the metric.
Integration that the metric sends data from.
Property of the environment it’s reporting from.
Exact values into the search field. For example, search a host name to find out what data the host reported.
Search guidance and syntax 🔗
Refine a search by entering more search terms or by adding filters. You can add filters by selecting in the main menu, or matching metadata in any of the search results. The following table outlines guidance for search syntax. The Metric Finder doesn’t support advanced search operations like combining search terms with Boolean operators, wildcard matching in plain text search terms, or exact matches on multiple search terms aren’t supported.
Syntax |
Notes |
|---|---|
. |
Enter in a dot (.) in the search bar to see a list of possible completions for the prefix you’ve already searched. |
: |
Enter in the name of a dimension or property followed by (:), to see a list of possible values for that key in your data. |
* |
Option to include wildcards in your filters. For example, |
! |
Use (!) (NOT) in your filters to exclude results. For example, |
Search results 🔗
Each search result is the name of a metric. Search results are URL-addressable; you can link to a set of search results using the URL for that search. For example, a plaintext search for docker cpu prod returns the top 100 metrics that contained docker, cpu, or prod in their name or metadata. Splunk Observability Cloud highlights the metric name, or metadata, to show what search terms it matches.
Add metric descriptions 🔗
Descriptions help users understand what metrics are measuring, especially when the names of metrics are jargon or difficult to recognize. To add a metric description select Add description, or select Edit description to edit the custom description. Some metrics have built-in descriptions like integrations, this provided description is always shown and isn’t editable. The maximum length of a metric description is 1,024 characters.
If you hover over a metric name a tooltip opens that provides information about the metric:
Metric name
Description and type
Time of creation
Number of time series
Match metadata 🔗
When a search term that you typed also matches metric metadata (such as a dimension name or a property value), that match is shown under the metric name with a grey outline. Select the match, or the (+) icon, to add it to your search as a filter. To exclude the metadata from your search results, select the (-) icon.
Increase search results 🔗
If your search didn’t match any metrics, change the query or remove a filter. Shorter search terms like util are likely to match more results than longer terms like utilization. If you don’t see any results using a long search term, try shortening it to a prefix or separating it into a few smaller terms. For example, break NumRequests into num requests.
You can also uncheck Active metrics only to include inactive metrics that are no longer actively sending data to Infrastructure Monitoring in your search. By default, the Metric Finder looks for metrics that actively send data. If you uncheck this control, the time series count shown when you hover over a metric name include matching inactive time series as well as active time series.
Open a chart from a metric 🔗
When you have found the metric you want, select the metric name to open the Chart Builder and to start building a new chart with that metric. The new metric plot includes any filters that were part of your search, as well as any matching metadata on the search result that you selected. For more information on using the Chart Builder, see Plot metrics and events using chart builder in Splunk Observability Cloud.
To return to search results from the new chart, select either the Close button or the Back button in your browser. If you want to save the chart to a dashboard before exiting, select the Save as button.
Manage custom categories 🔗
Custom categories help you quickly find metrics related to commonly used dimensions in your organization. If your administrators haven’t created any custom categories, the custom categories section isn’t visible. Infrastructure Monitoring administrators can add them. See Manage custom categories.
When you select a custom category value or integration, a key-value pair is added as a search filter, and a metric search is run.
If there are more than a few values for a custom category, you can select Show more to see the first 100 results. If you don’t see the value that you’re looking for in the longer list, you can enter it in the search field to return more relevant search results.
Use custom categories to browse for metrics using features that are unique to your organization’s data, like custom tags or properties. If you use custom metrics, you can set up custom categories to surface key dimensions from your data to help your user get started. Administrators can add custom categories.
To display dimensions and properties as custom categories on the Metrics page, select Add custom categories. Select Save and close when you finish adding categories. The custom categories you added are available for use on the Metrics page. Selecting Edit lets you add, delete, or update existing custom categories.
Search the Metadata Catalog 🔗
Use the Metadata Catalog to find, view, and edit information about the metadata in your system, such as dimensions, properties, and tags. In the Metadata Catalog, the search bar automatically expands a menu with a matching list of results. The list contains metrics, properties, and tags. Both dimensions and custom properties are marked as property.
Note
You can’t add or edit a new dimension to any object after data ingest in Splunk Observability Cloud. To learn more, see When to use each metadata type in Infrastructure.
Follow these steps to search for metadata and edit metadata in the Metadata Catalog:
Go to .
Enter your search criteria in the Search bar. You can search for metrics, dimensions, custom properties, and tags.
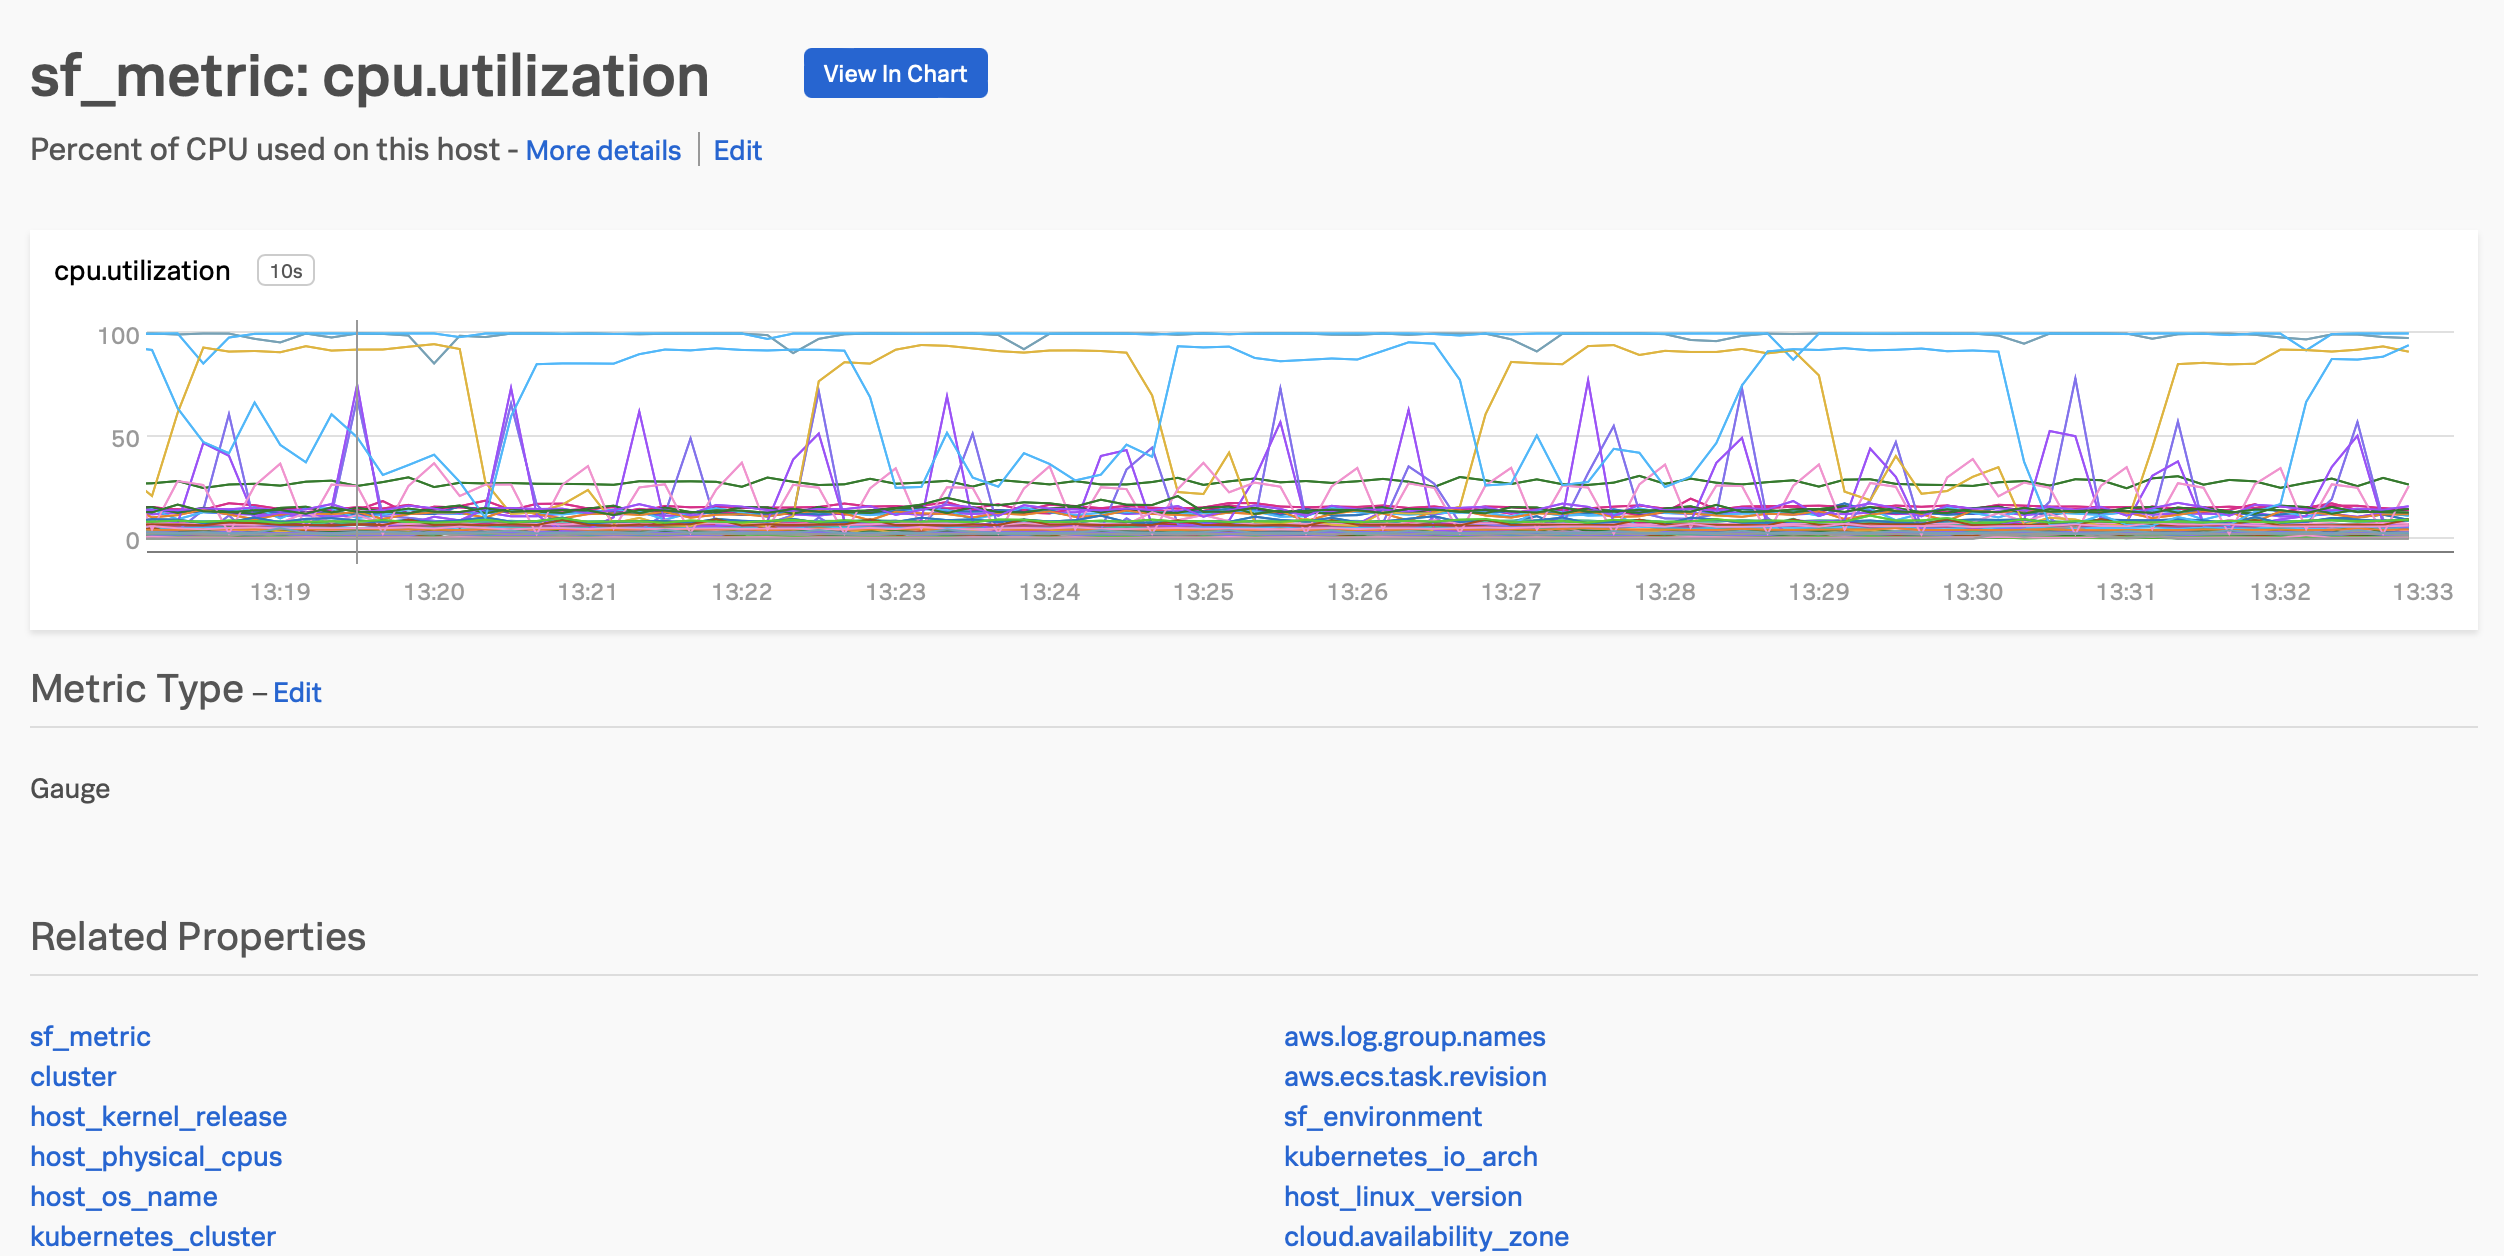
Splunk Observability Cloud displays a chart for the metric, the metric type, and a list of dimensions and custom properties associated with the metric. To search for a metric, enter the metric name you want to find. The following image shows an example output for the metric cpu.utilization.
Search for a dimension or custom property 🔗
To search for a dimension or a custom property, do one of the following:
Enter a dimension or custom property key. For example, enter
host.name. Splunk Observability Cloud displays a list of associated metrics and a list of possible values for the key.Enter the complete dimension or custom property key-value pair. For example, enter
host.name:appsvr01. Splunk Observability Cloud displays all the metrics, metadata, and data links associated with the key-value pair.To search for a tag, enter the tag you want to search for. For example, enter
kubernetes_service_redis-cart. Splunk Observability Cloud displays a list of metrics and properties (dimensions and custom properties) assigned with the tag.
Add or edit metadata 🔗
The following table outlines navigation paths for adding and editing metadata. You can also view and edit a chart when searching for a metric using the Metadata Catalog. For more information on naming custom properties and tags, see Guidance for metric and dimension names.
Edit action |
Path |
|---|---|
Metric type |
Select Edit then Metric Type. |
Custom property |
Select Edit or Add new property… in the Properties section. |
Tag |
Select Edit or Add new tag… in the Tags section. |
Data links |
Select New Link in the Data Links section. |
Chart associated with a metric |
Select View In Chart. |