Explore your traces using the classic Traces page 🔗
Use Splunk APM’s Traces page to search through full-fidelity trace data to find a specific trace you’re interested in. The Traces page searches all currently retained traces; see Data retention in Application Performance Monitoring (APM) to learn more about the default trace retention period.
Use these steps to navigate to the classic Traces page:
From the Splunk Observability Cloud landing page, select APM.
From the APM landing page, select Traces. A list of recent traces opens.
Note
Select Switch to Trace Analyzer to use the new Trace Analyzer to search traces and identify patterns in the full-fidelity trace data without prior knowledge of which tags are relevant. Trace Analyzer is available to all Splunk Observability Cloud users that use Splunk APM. See Explore your traces using Trace Analyzer in Splunk APM for more info.
- (Optional) Use the filter bar at the top of the list to narrow the list of traces. If you select multiple items in a filter, they are treated with an AND Boolean operator. For example, if you select multiple services in the service filter, only traces containing spans from ALL of the selected services appear in the results. The following filter options are available:
Time range
Environment
Workflow
Services
Tags
(Optional) Select a minimum or maximum trace duration and toggle the Errors Only switch to include only traces containing errors in your search.
(Optional) Select the header of the Start time or Duration column to sort your traces by that field.
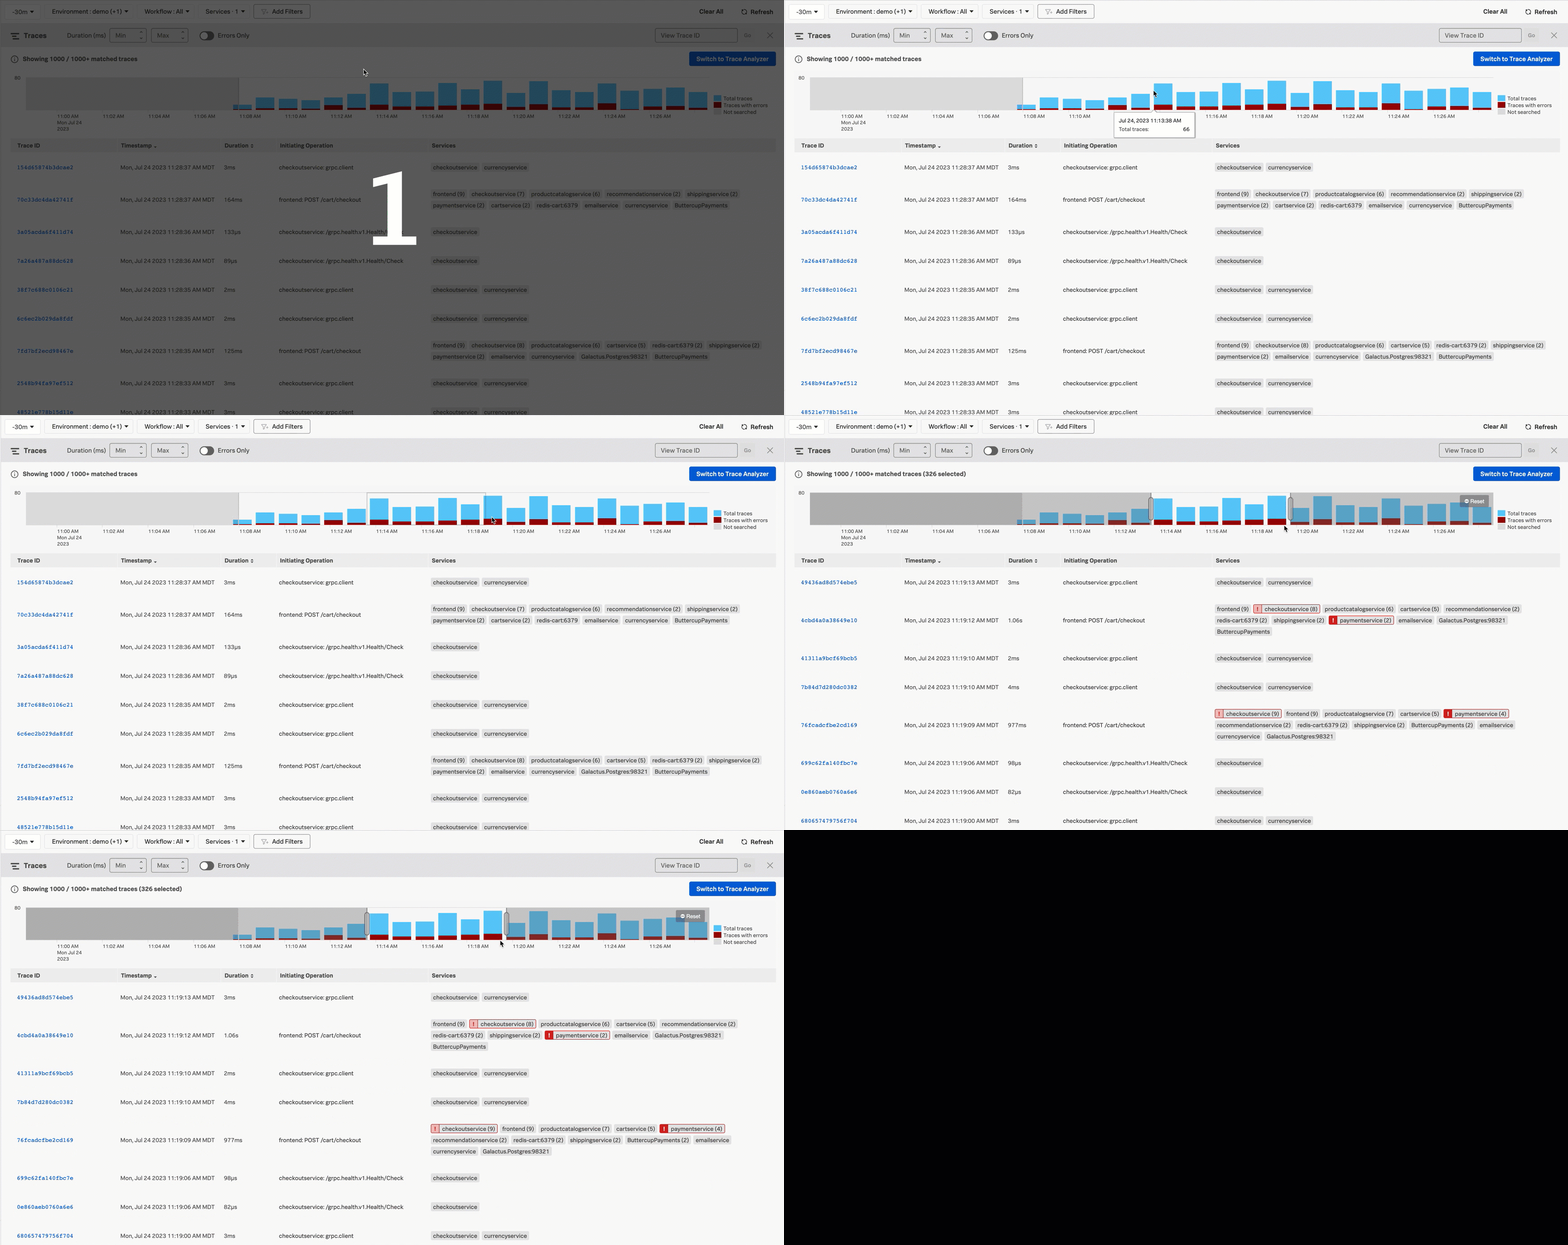
While Splunk APM runs the search, a time chart provides visual feedback on the trace history searched so far. The chart also displays the number of requests and errors within each slice of time that has been searched. You can narrow your search to a specific time range of interest by selecting a time range within the chart.
The following animated gif demonstrates how to select a time range in the chart:

Note
The Timestamp column displays the time zone set in your profile. By default, the time zone is automatically detected from your browser. If you want to change to a different time zone to match the experience of a teammate in another time zone, navigate to Account Settings and make a selection in the Time Zone field.
Trace Search trace limit 🔗
The Trace Search has a limit of 1,000 traces. The Trace Search retrieves traces at the end of the time window you select. When 1,000 traces are matched, the chart stops populating.