Explore your traces using Trace Analyzer in Splunk APM 🔗
Use Trace Analyzer to search traces generated by your application and identify patterns in the full-fidelity trace data without prior knowledge of which tags are relevant.
Trace Analyzer is available to all Splunk Application Performance Monitoring (APM) users.
The following examples are questions that Trace Analyzer can help you answer:
How many traces and traces with errors exist for a given combination of service, environment, and tags?
For a given issue, which customers experience the highest error rate?
How do I locate error spikes in my trace data?
When and where are customers experiencing slowness?
How many customers are experiencing slowness?
When to use Trace Analyzer 🔗
Splunk Observability Cloud provides several tools for exploring application monitoring data. Trace Analyzer is suited to scenarios where you have high-cardinality, high-granularity searches and explorations to research unknown or new issues. See Guidelines for working with low and high cardinality data.
The following table presents what each APM tool is best suited for:
APM tool |
Scenario |
Analysis level |
Cardinality |
Documentation |
|---|---|---|---|---|
Trace Analyzer |
Identify patterns for unindexed tags |
Trace-level analysis |
High cardinality |
|
Tag Spotlight and service map |
Surface trends for indexed tags |
Service-level analysis |
Medium cardinality |
|
Monitoring MetricSets |
Get alerts on service degradation |
Workflow and service-level analysis |
Low cardinality |
Explore your trace data 🔗
To open Trace Analyzer, select Traces in Splunk APM and select Switch to Trace Analyzer.
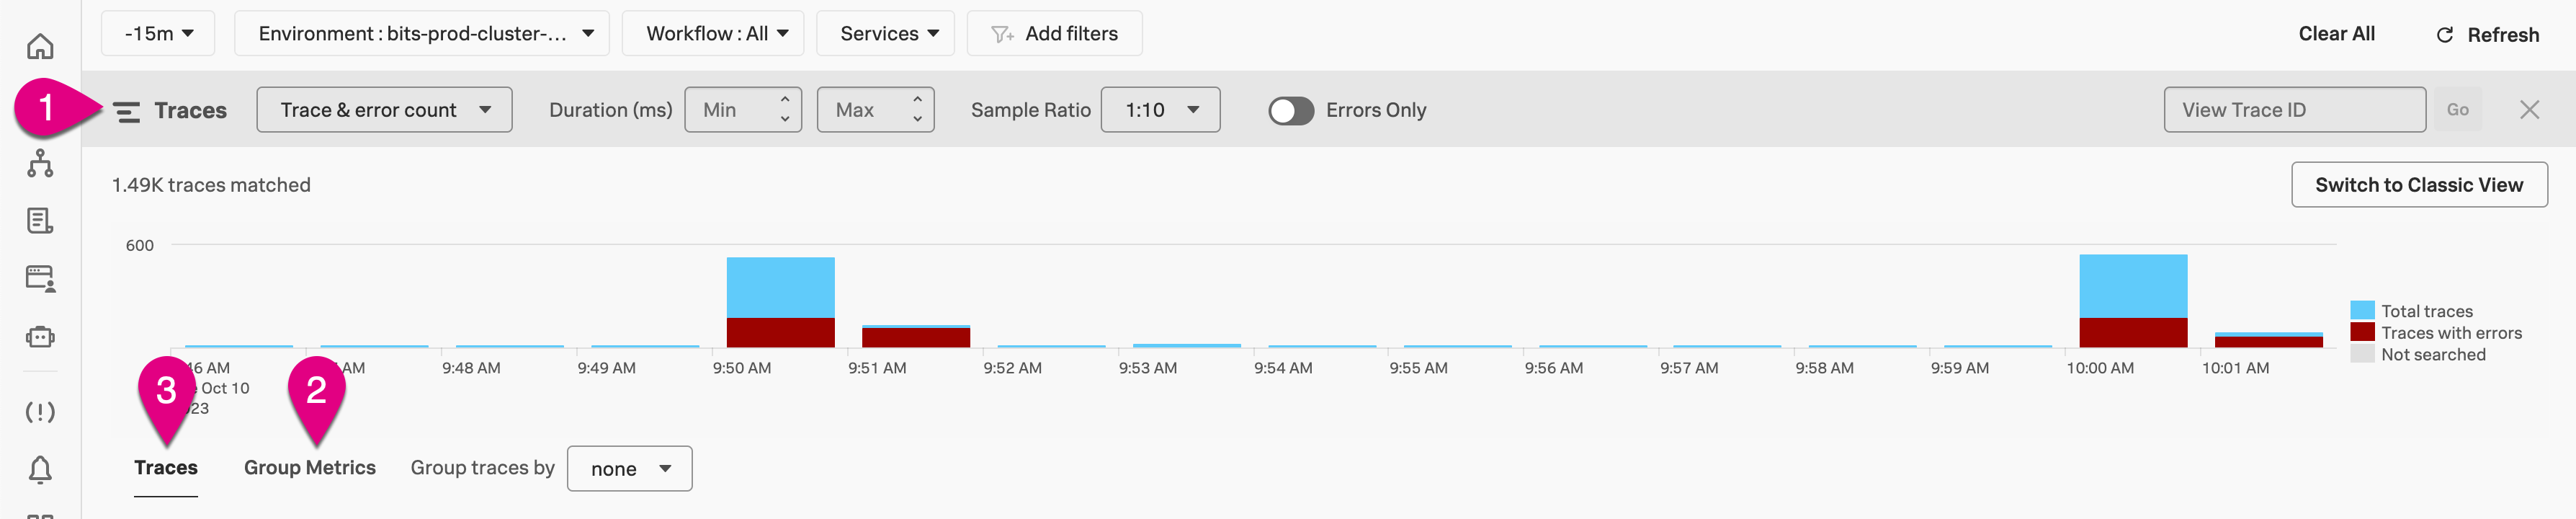
To explore your trace data, use the following controls, which are numbered as callouts in the image. Additional details for each callout follow the image:
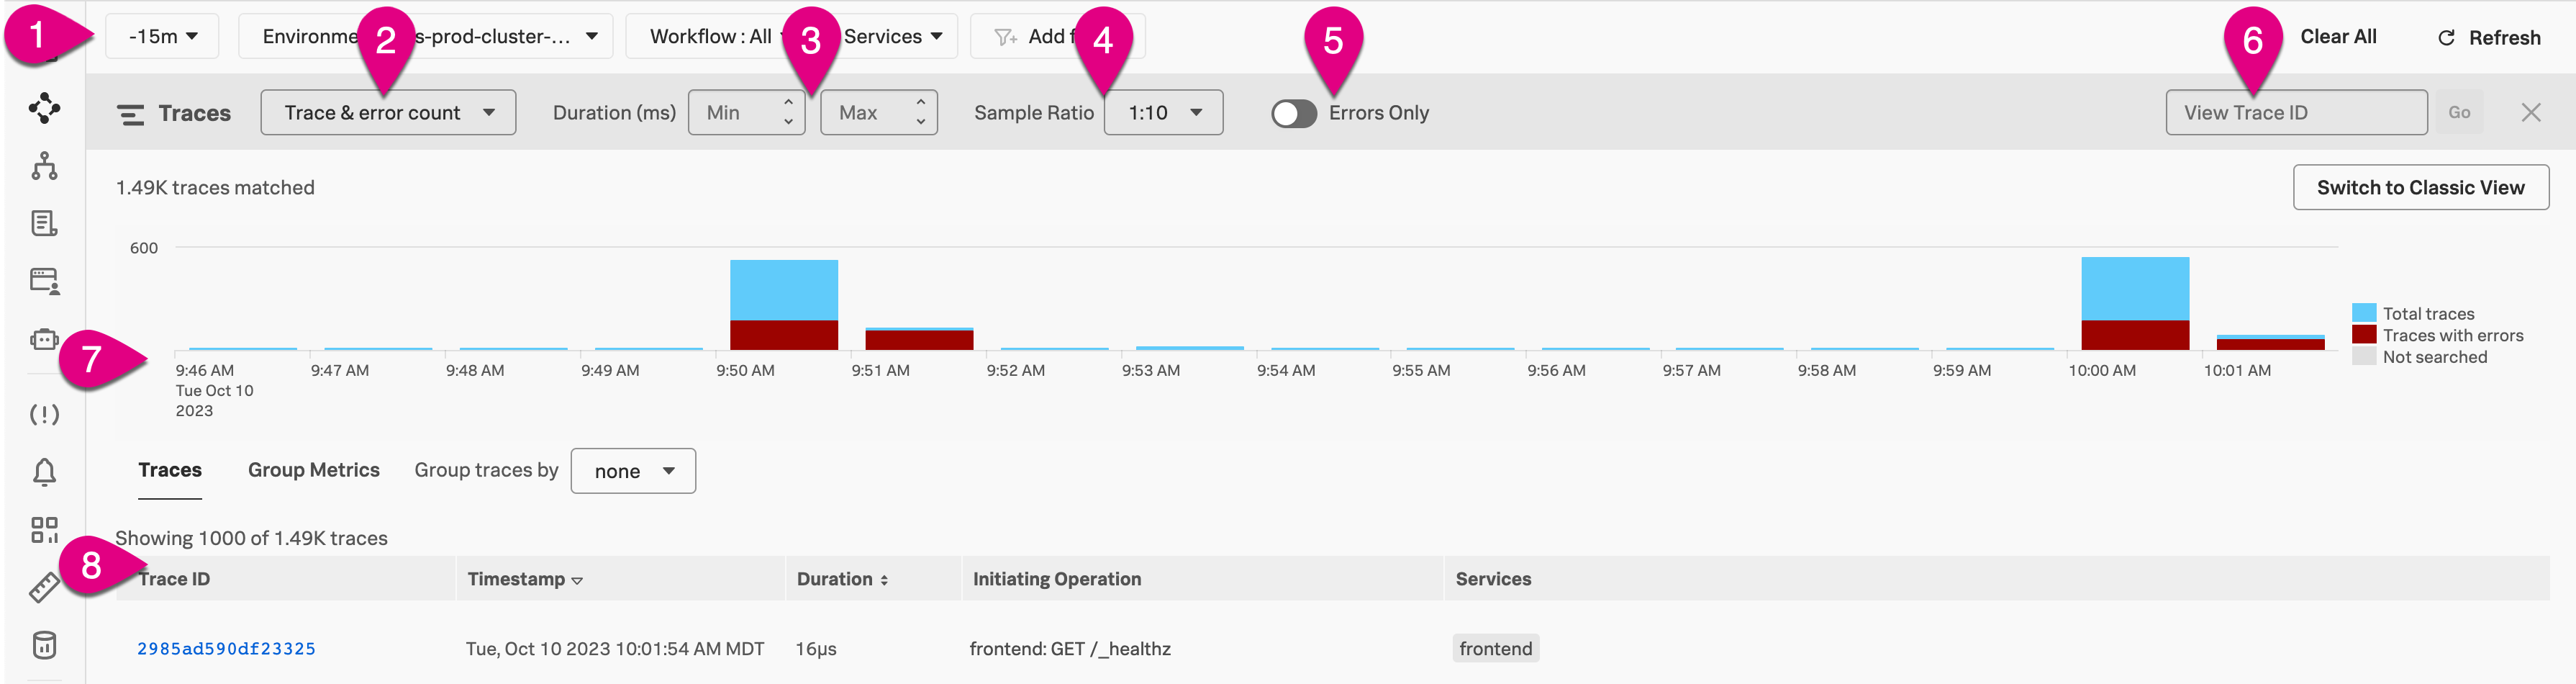
Use the filter bar to refine the traces by time range, environment, workflow, services, and tags. For tag filters, both equal to (
=) and not equal to (!=) operators are available.Use the minimum and maximum trace duration to refine the traces that are included by their duration.
Use the sample ratio to select all traces or 10% of traces. By default the sample ratio is set to 1:10. Once you make a selection, your selection is preserved.
Use the Errors Only switch to show only traces with errors.
Use the search to look up a trace by its ID.
Use the real-time chart to view the count of total traces with error or a trace duration heatmap depending on your selections.
Use the table of traces to view trace details or group metrics based on a tag.
Trace Analyzer searches all traces within the default retention period of 8 days. See Data retention in Application Performance Monitoring (APM) to learn more about the default trace retention period.
Explore trace and error counts 🔗
When you view Trace & error count, the real-time chart shows total traces and traces with errors in a stacked bars chart. Select and drag over the bars in the chart to select a specific period within the available time frame. Select Filter to selection to update the time range filter.
Explore trace duration 🔗
When you view Trace Duration, the real-time chart shows a heatmap of traces by duration. The heatmap represents 3 dimensions of data:
Time on the x-axis
Trace duration on the y-axis
The traces (or requests) per second are represented by the heatmap shades
Select and drag over the bars in the chart to select a specific time period and trace duration range. Select Filter to selection to add a time range filter and a min and max duration filter.
The Traces per second that represent the heatmap shades are scaled for the data in range based on your filters so, the trace per second legend values change based o the data in frame.
View group metrics by tag 🔗
You can group all available traces by a single tag or attribute. For example, you can group all traces from your service by database table, host name, or HTTP status code.
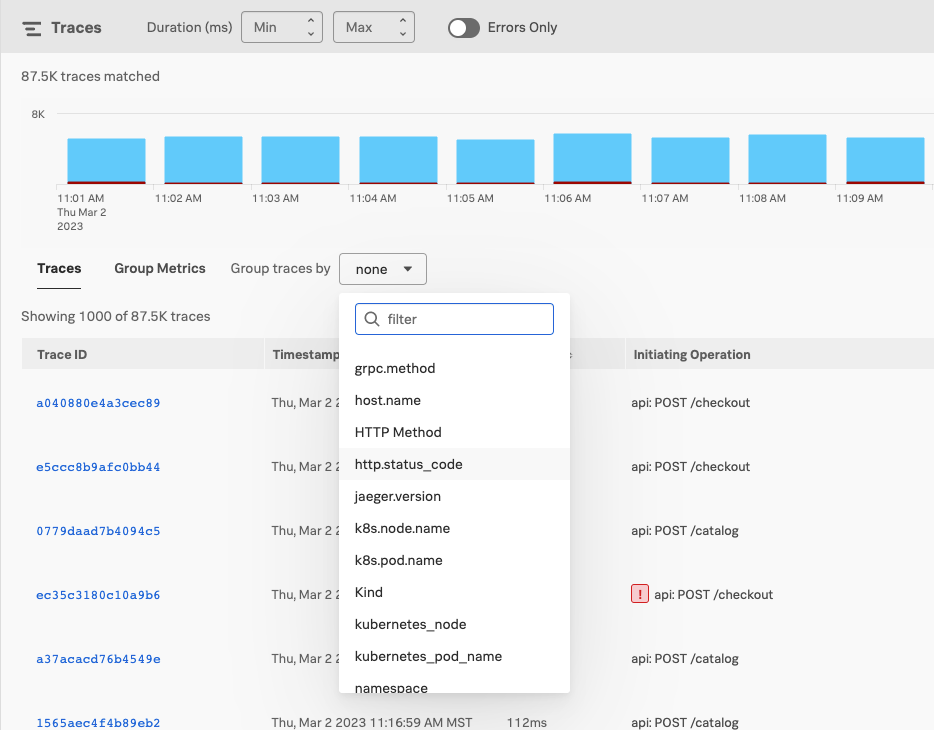
The resulting Group Metrics tab shows a breakdown of the top 100 values for the selected tag, ranked by the number of errors.
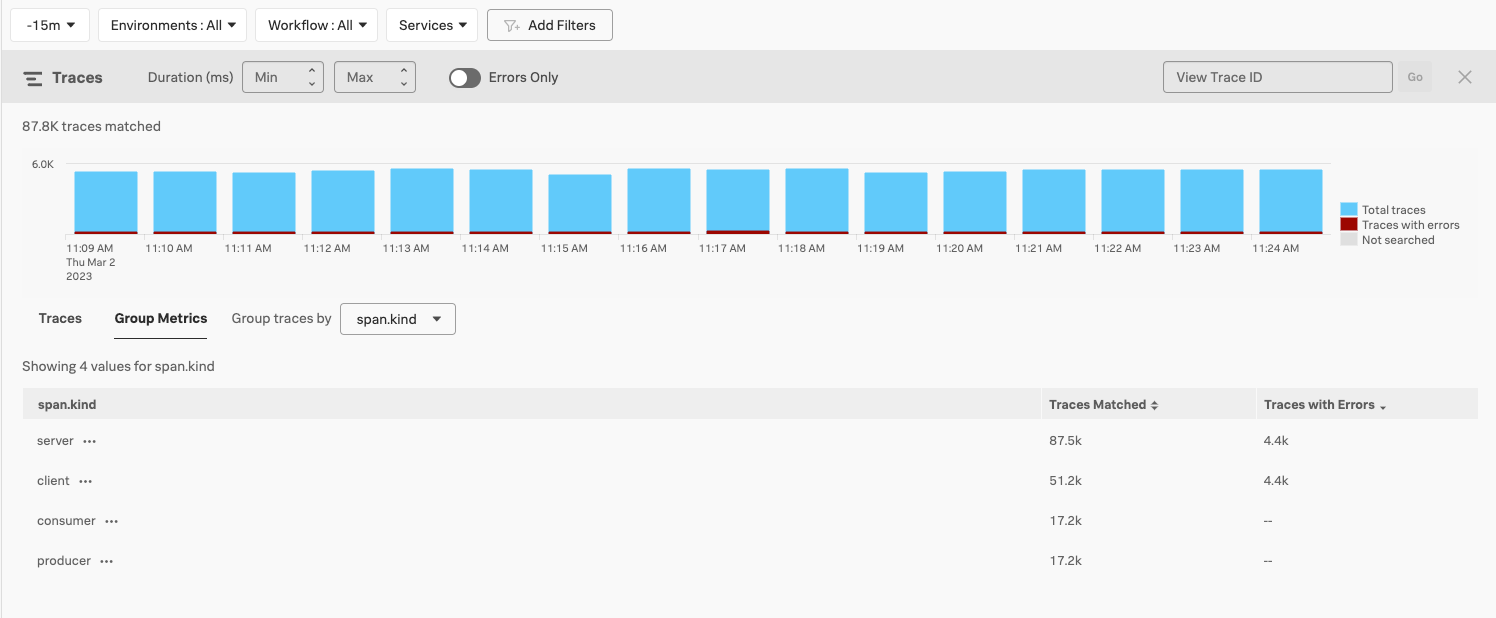
You can order both tables by the number of matching traces.
Trace Analyzer trace limits 🔗
Within the Trace Analyzer interface, there are 3 different display limits, numbered as callouts in the following image.
- The limits of the Trace Analyzer chart depend on the filters used and the chart selected:
When using a combination of the time range, environment, workflow, and services filters, the Trace & error count chart displays 8 days of traces.
When using either the operation or tag filters the Trace & error count chart displays at least 1,000 traces and at least 6 hours of traces. After there are 1,000 traces and 6 hours of trace data, the trace search stops.
The Trace duration chart displays at least 1,000 traces and at least 6 hours of traces. After there are 1,000 traces and 6 hours of trace data, the trace search stops.
The Group Metrics tab displays at least 1,000 traces and at least 6 hours of traces. After there are 1,000 traces and 6 hours of trace data, the trace search stops.
The list of traces displayed on the Traces tab has a limit of 1,000 traces. Trace Analyzer searches for traces at the end of the time window you select. When 1,000 traces are matched, the list stops populating.
What to expect in Trace Analyzer when using the visibility filter API 🔗
If you are using the visibility filter API to block specific span tags in Splunk APM, here is what you can expect to see in Trace Analyzer:
If you hide tags using the
hiddenTagsfield in the visibility filter API, then you can’t use these tags in the filter bar or trace grouping.If you specify the visible tags using the
visibleTagsfield in the visibility filter API, then you can use only the visible tags in the filter bar or trace grouping.
See Use visibility filter APIs to block data in Splunk APM and Visibility filters in APM in the Splunk Developer Guide to learn more about visibility filters.
Learn more 🔗
See the following links for more information on Trace Analyzer and traces in Splunk APM: