Migration process from the Smart Agent to the Splunk Distribution of the OpenTelemetry Collector 🔗
Note
Using this content assumes that you’re running the SignalFx SmartAgent in the Kubernetes, Linux, or Windows environments and want to migrate to the Splunk Distribution of OpenTelemetry Collector to collect telemetry data. Note that you cannot use both agents simultaneously on the same host.
Do the following steps to migrate from the Smart Agent to the Collector:
Estimate resource utilization (sizing) for the production environment
Deploy the Collector to the non-production environment using the updated configuration file
Deploy the Collector to a production host using the updated configuration file
1. Deploy the Collector in a non-production environment 🔗
Deploy the Collector in a non-production environment, for example, a development host or VM or a Kubernetes cluster in staging. The environment needs to be a copy or identical to your production environment.
Navigate to your instance of Splunk Observability Cloud and select in the navigation bar. Choose the platform you want to deploy the Collector to.

Follow the guided setup for your platform to deploy the Collector.
Note
See the tooltips within the guided setup for guidance about the initial configuration.
2. Validate the deployment of the Collector 🔗
Validate the deployment of the Collector using the following approaches in the described order.
Validate using dashboards 🔗
Start with looking at the built-in dashboard for the Collector where you can visualize:
Process metrics such as memory and CPU usage
Dropped, failure and success metrics for telemetry processing (metrics, spans, logs)
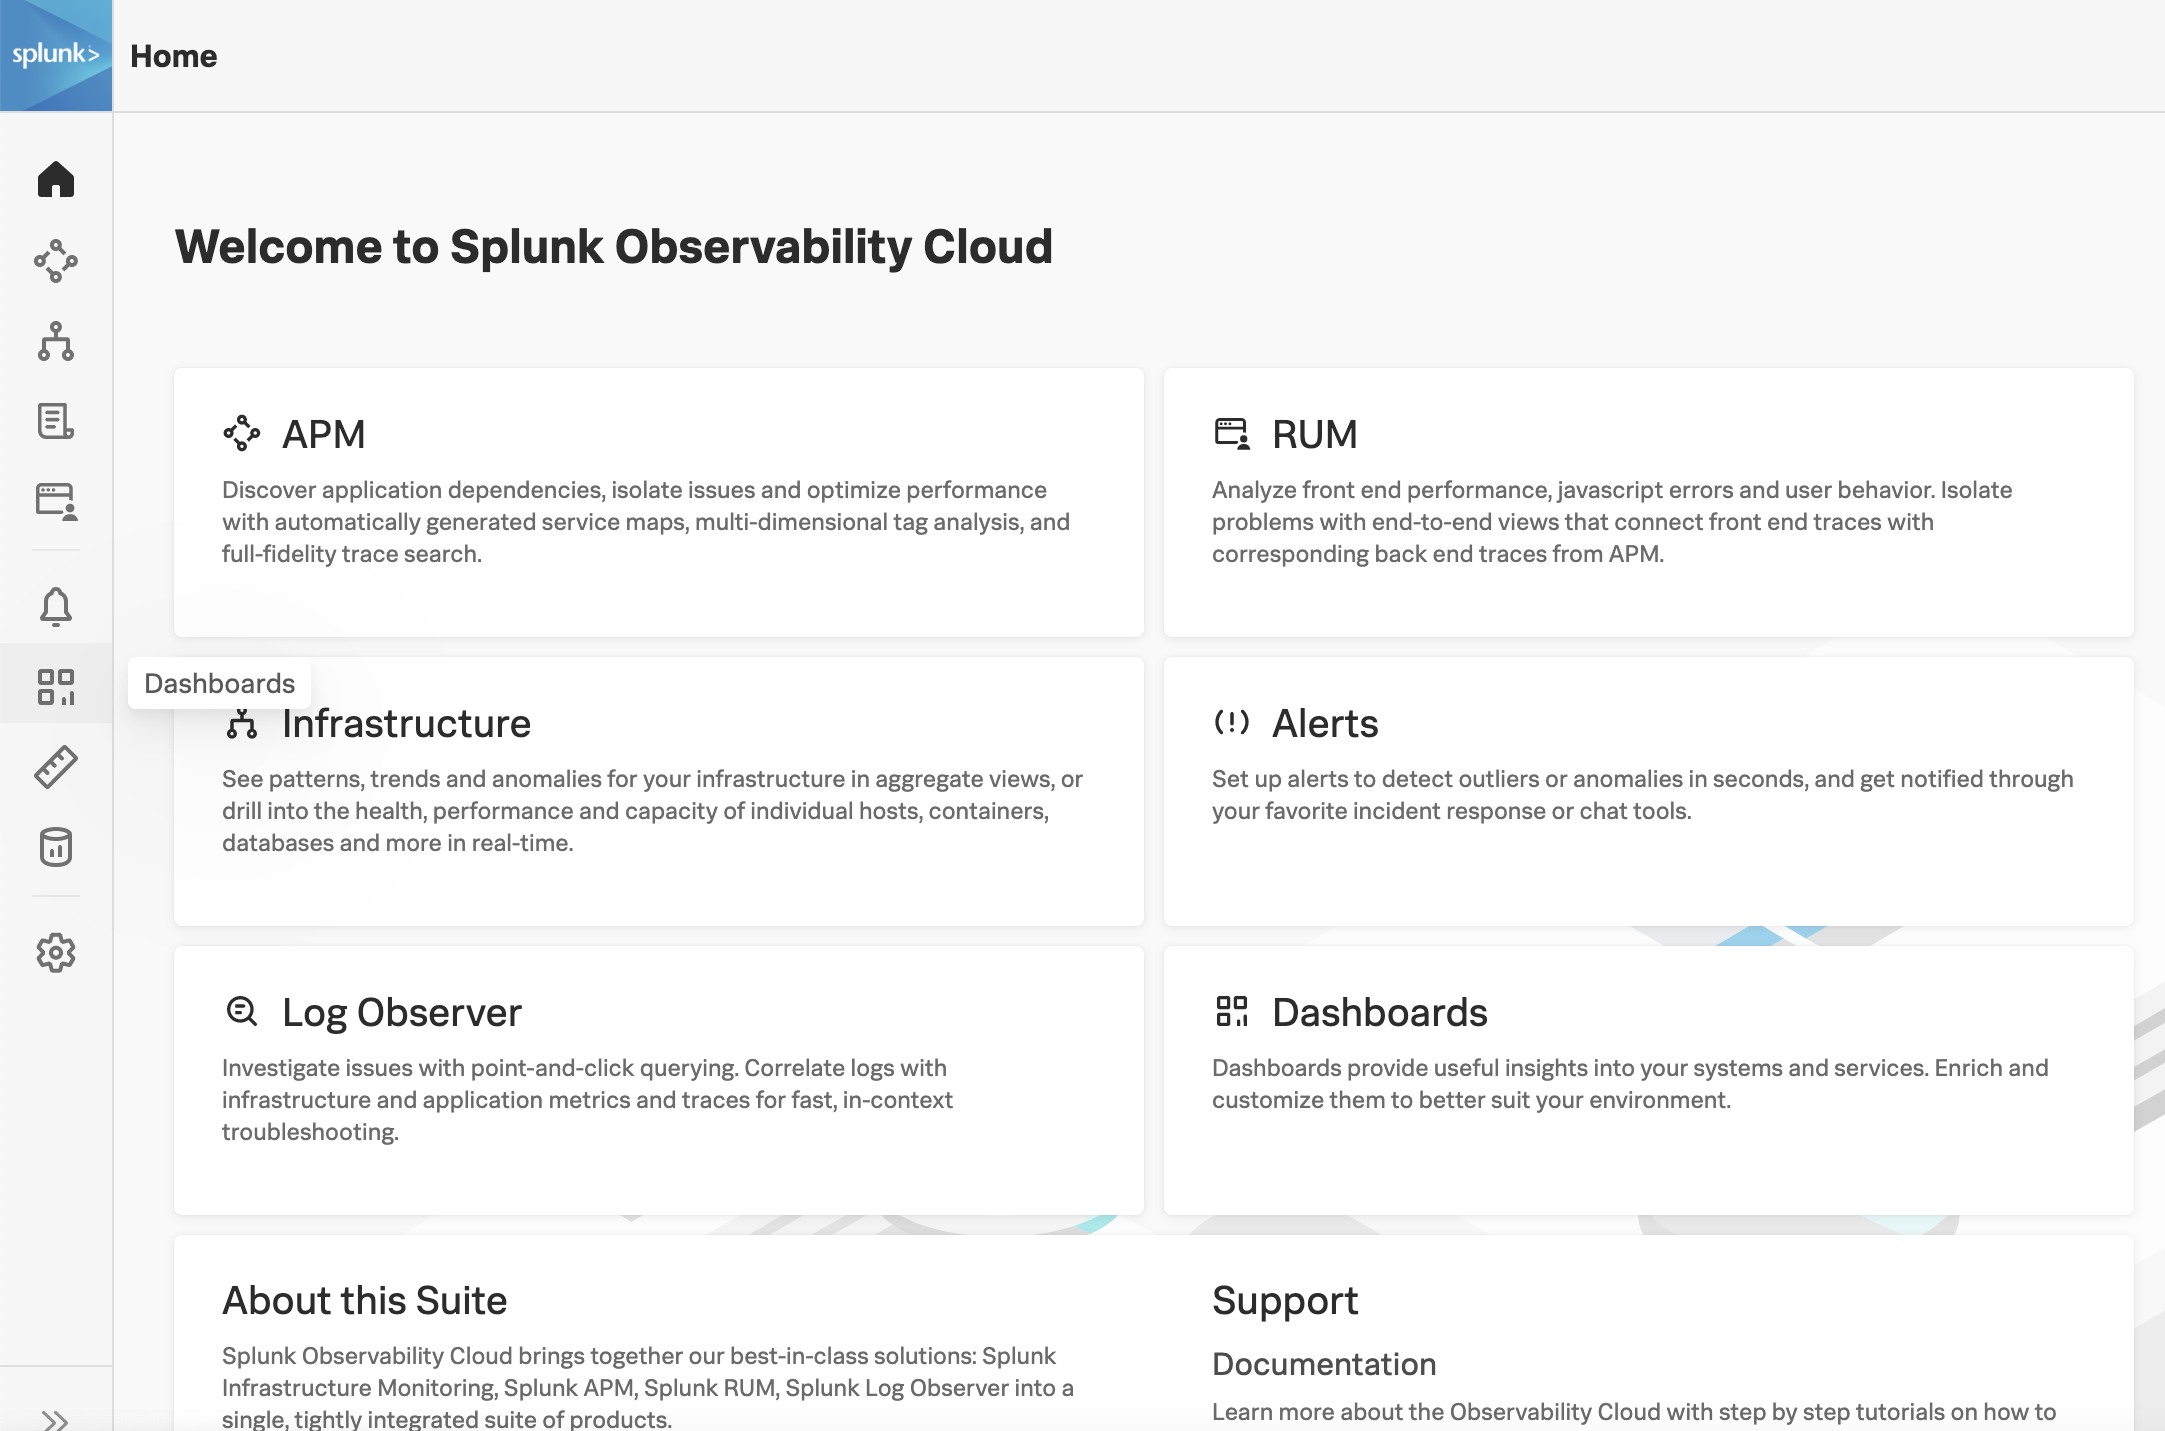
Select in the navigation bar.
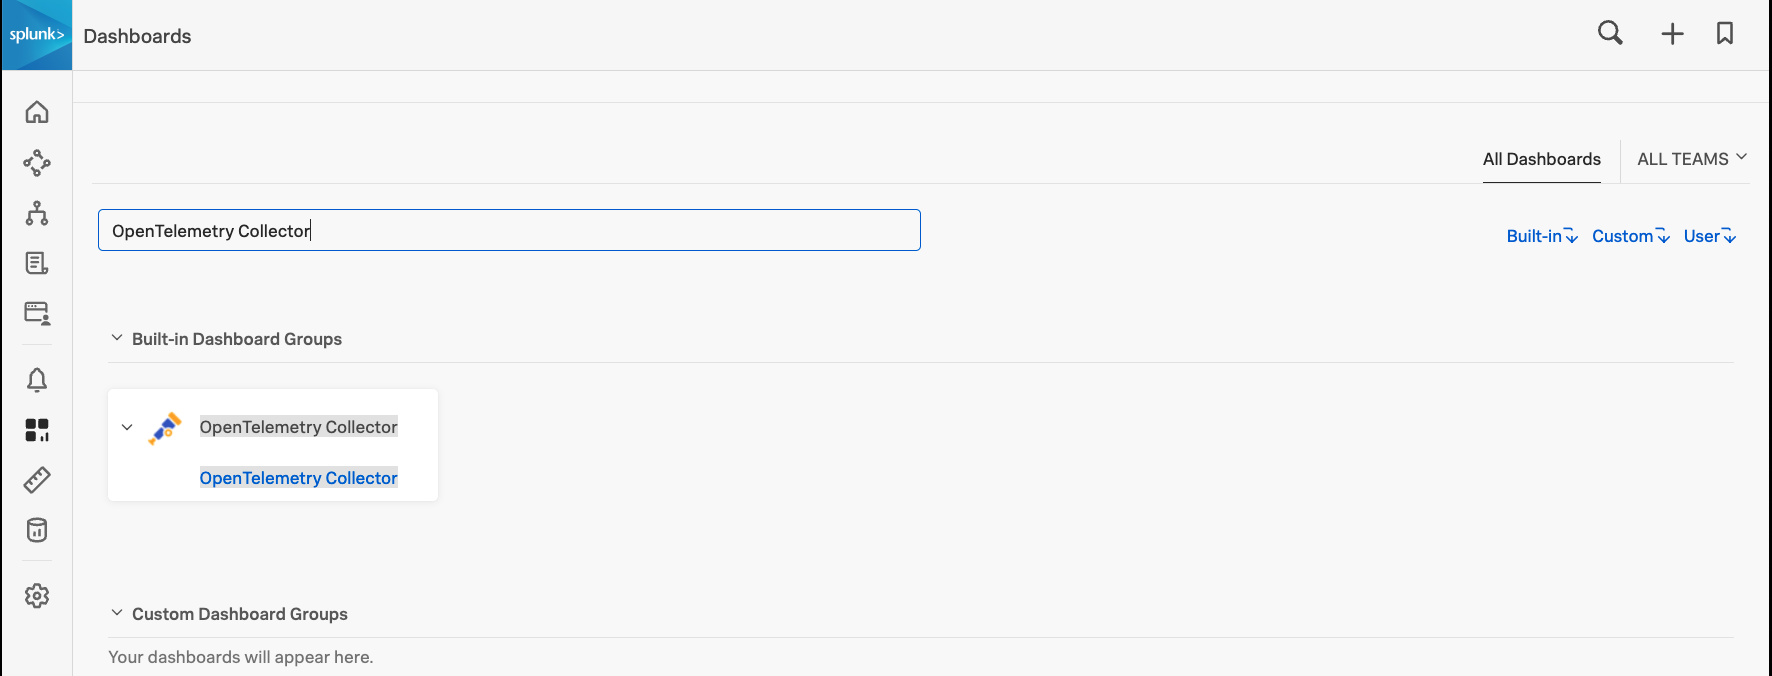
Search for OpenTelemetry Collector to access the built-in dashboard group.
Navigate to the Critical Monitoring section and review whether there is any data being dropped to ensure that there is no data loss and that telemetry data is not being dropped. You should see a chart for metrics, spans, and logs.
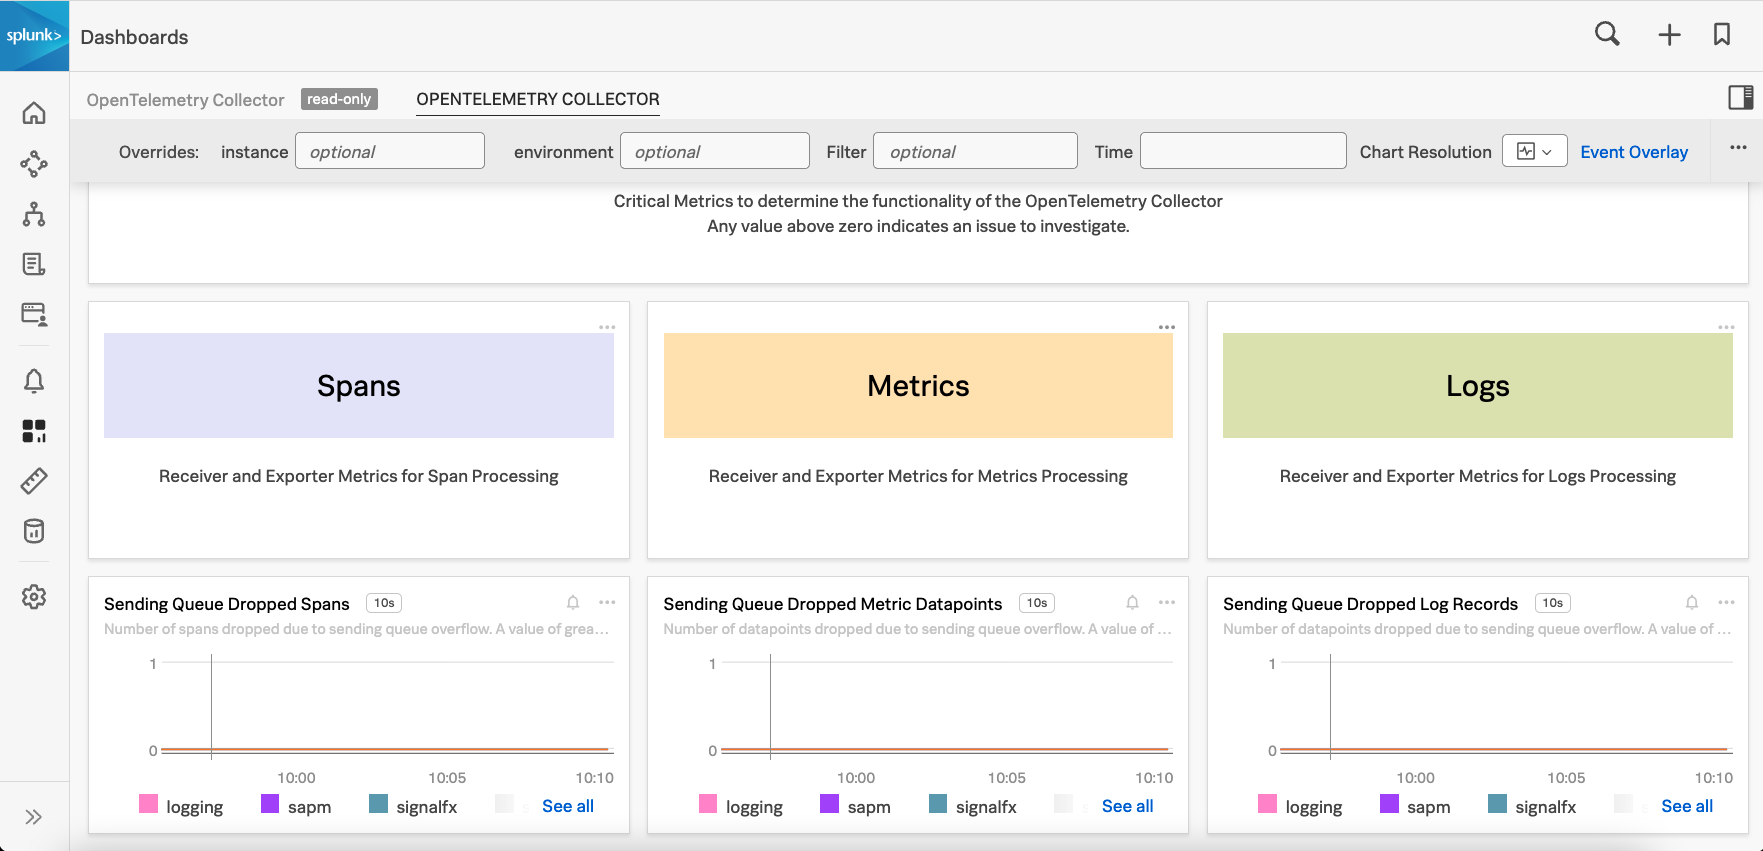
If any of the charts indicate a value above zero, then data is being dropped and you need to investigate why. To diagnose further, see Validate using logs.
Validate using zPages 🔗
To ensure that the Collector is configured correctly, activate the zPages extension.
This is exposed locally on port 55679 by default and can be used to give an overview of the following:
Services and build, runtime information (
http://localhost:<port>/debug/servicez)Running pipelines (
http://localhost:<port>/debug/pipelinez)Extensions (
http://localhost:<port>/debug/extensionz)Feature gates (
http://localhost:<port>/debug/featurez)``Spans and error samples (
http://localhost:<port>/debug/tracez)RPC statistics (
http://localhost:<port>/debug/servicez/rpcz)
For containerized environments, you can expose this port on a public interface instead of just locally. This can be configured by adding the following lines to the configuration:
extensions:
   zpages:
      endpoint: 0.0.0.0:55679
Validate using the Metric Finder 🔗
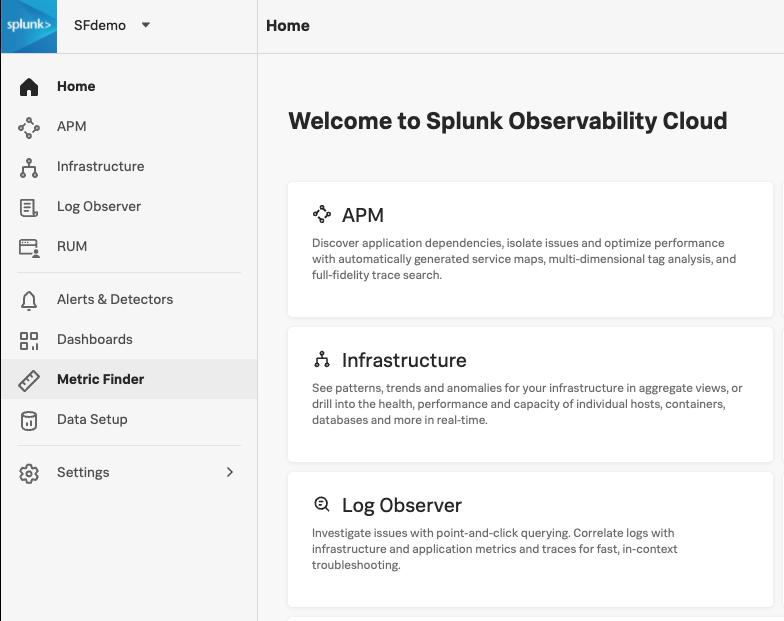
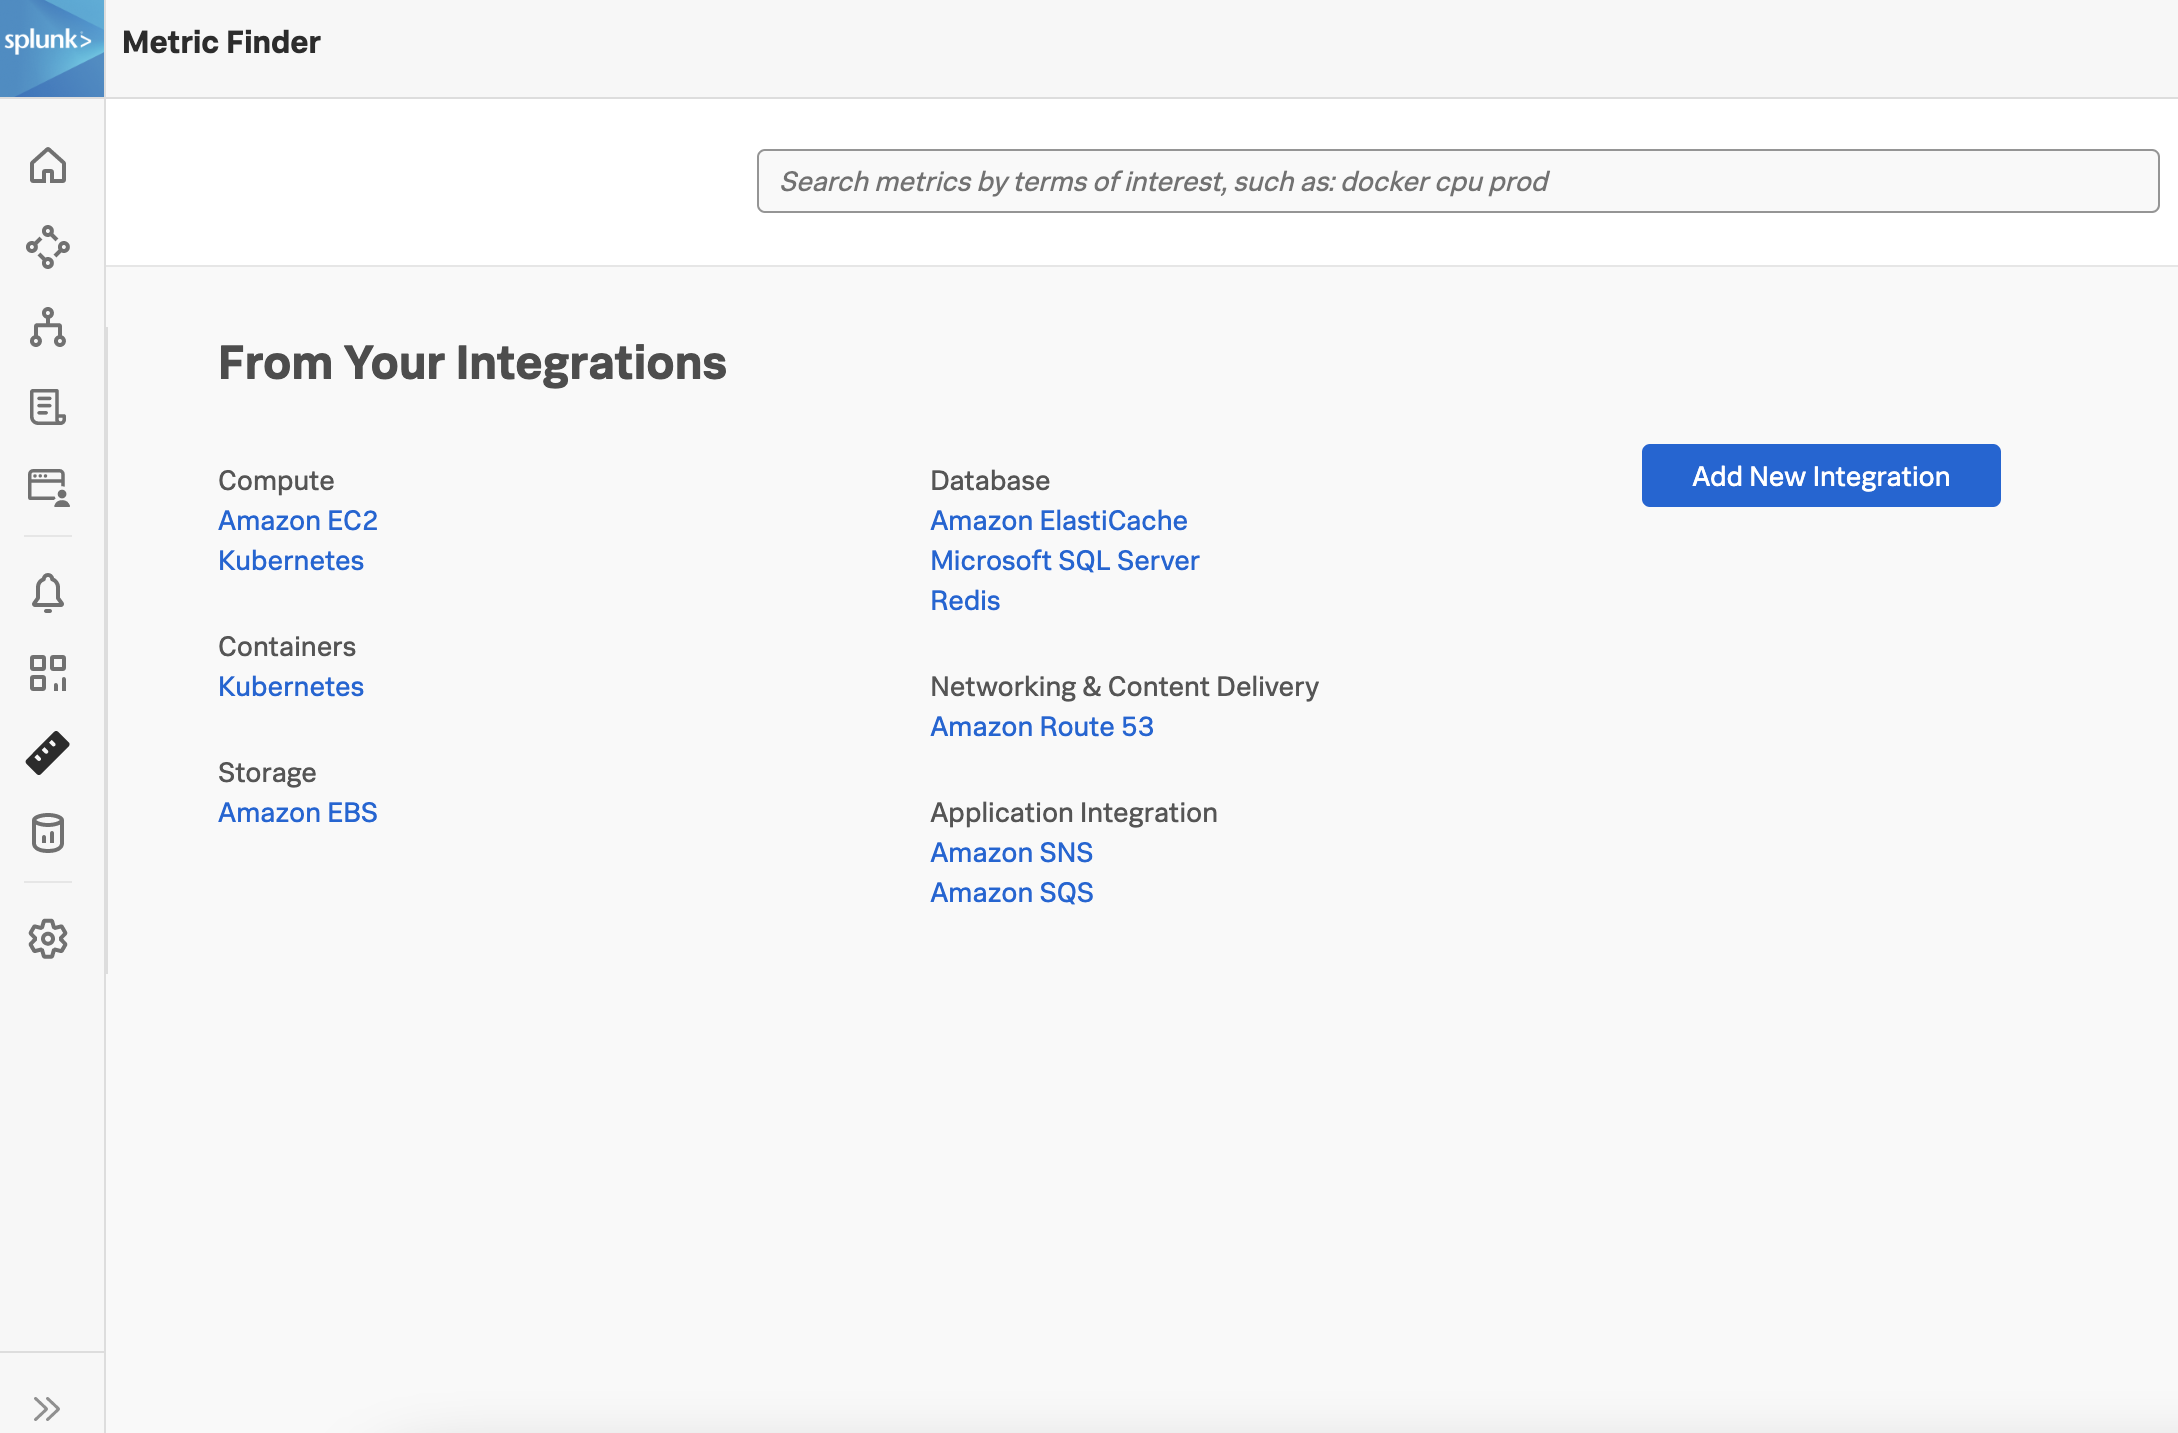
Use the Metric Finder to ensure that metrics are coming in from a specific integration. Select in the navigation bar.
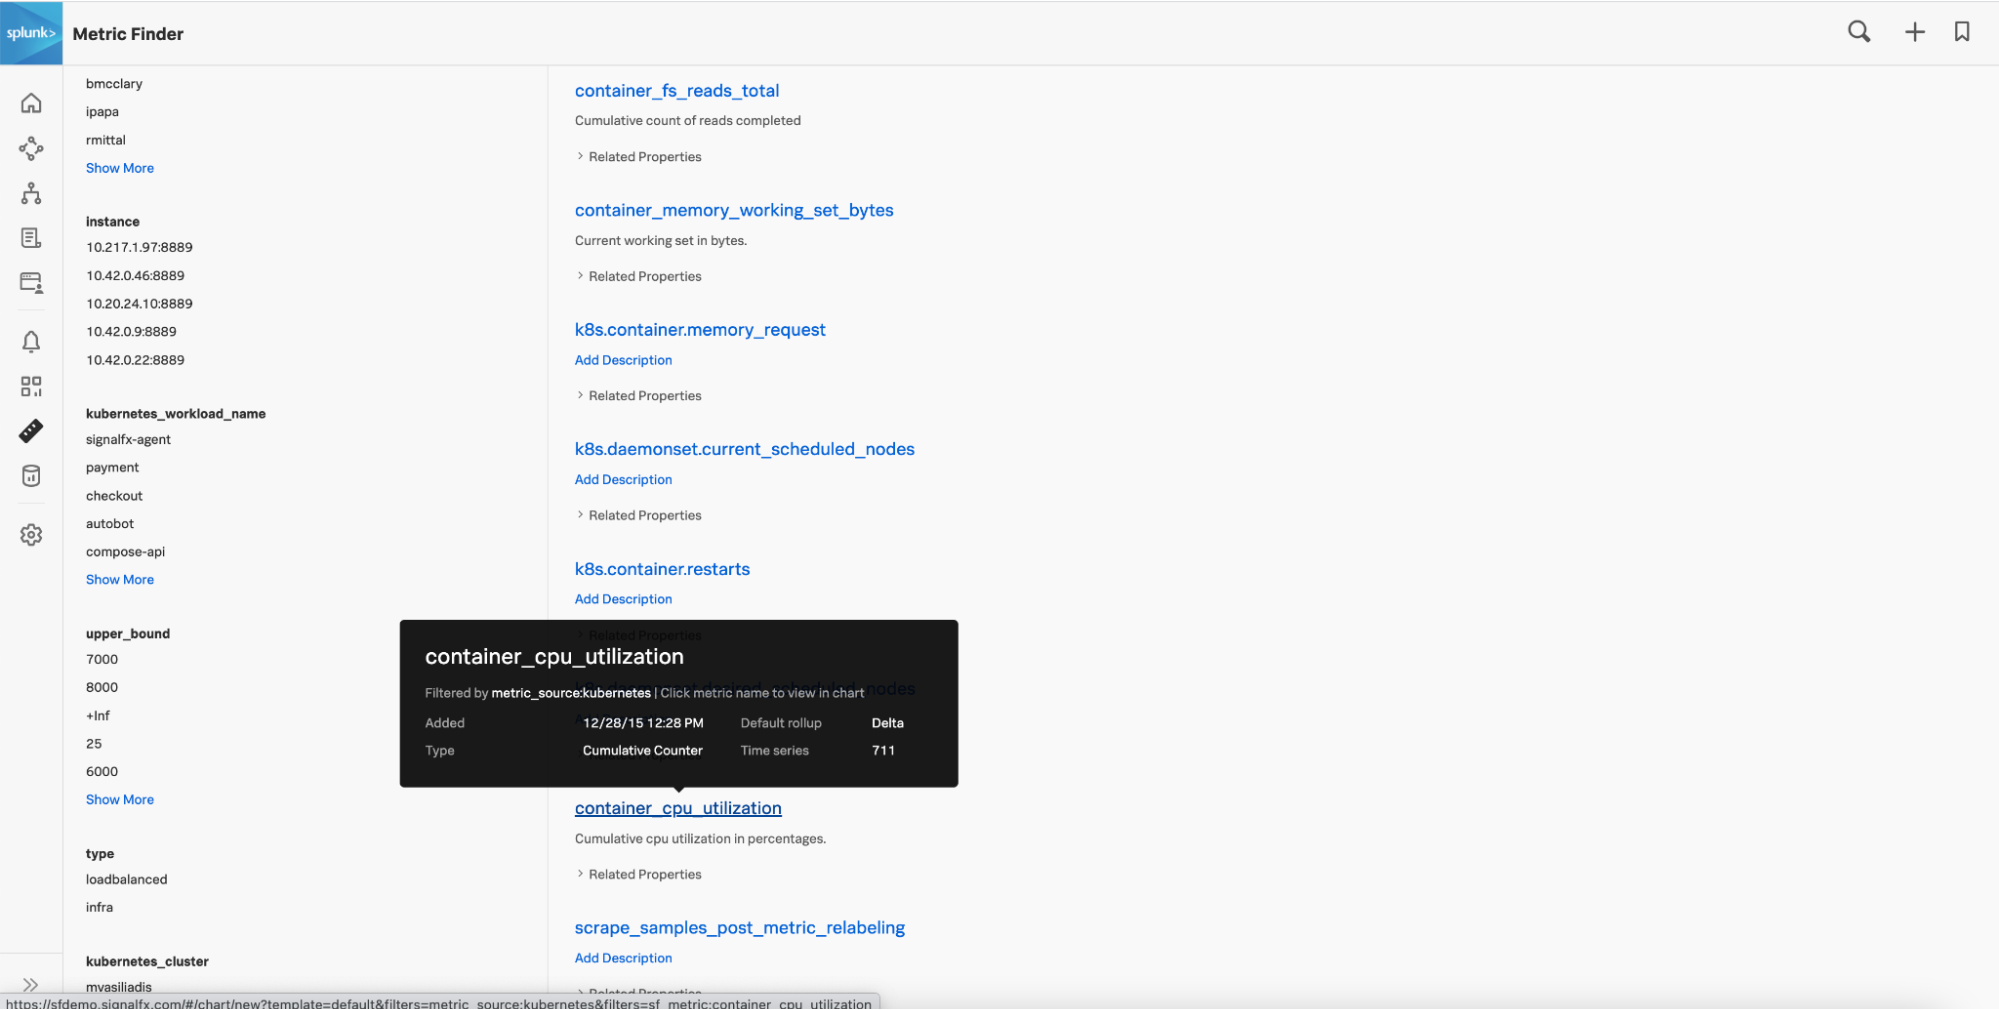
Find the integration as part of the list present. For example, if you deployed the Collector on the Kubernetes platform, scroll to the Containers category and select . Search results from all metrics being pulled in by default from the Kubernetes integration and the associated metadata that can be filtered or excluded are shown.
Select a specific metric, for example, .
You can now view the metric as a chart that displays the time series data across the duration you select.
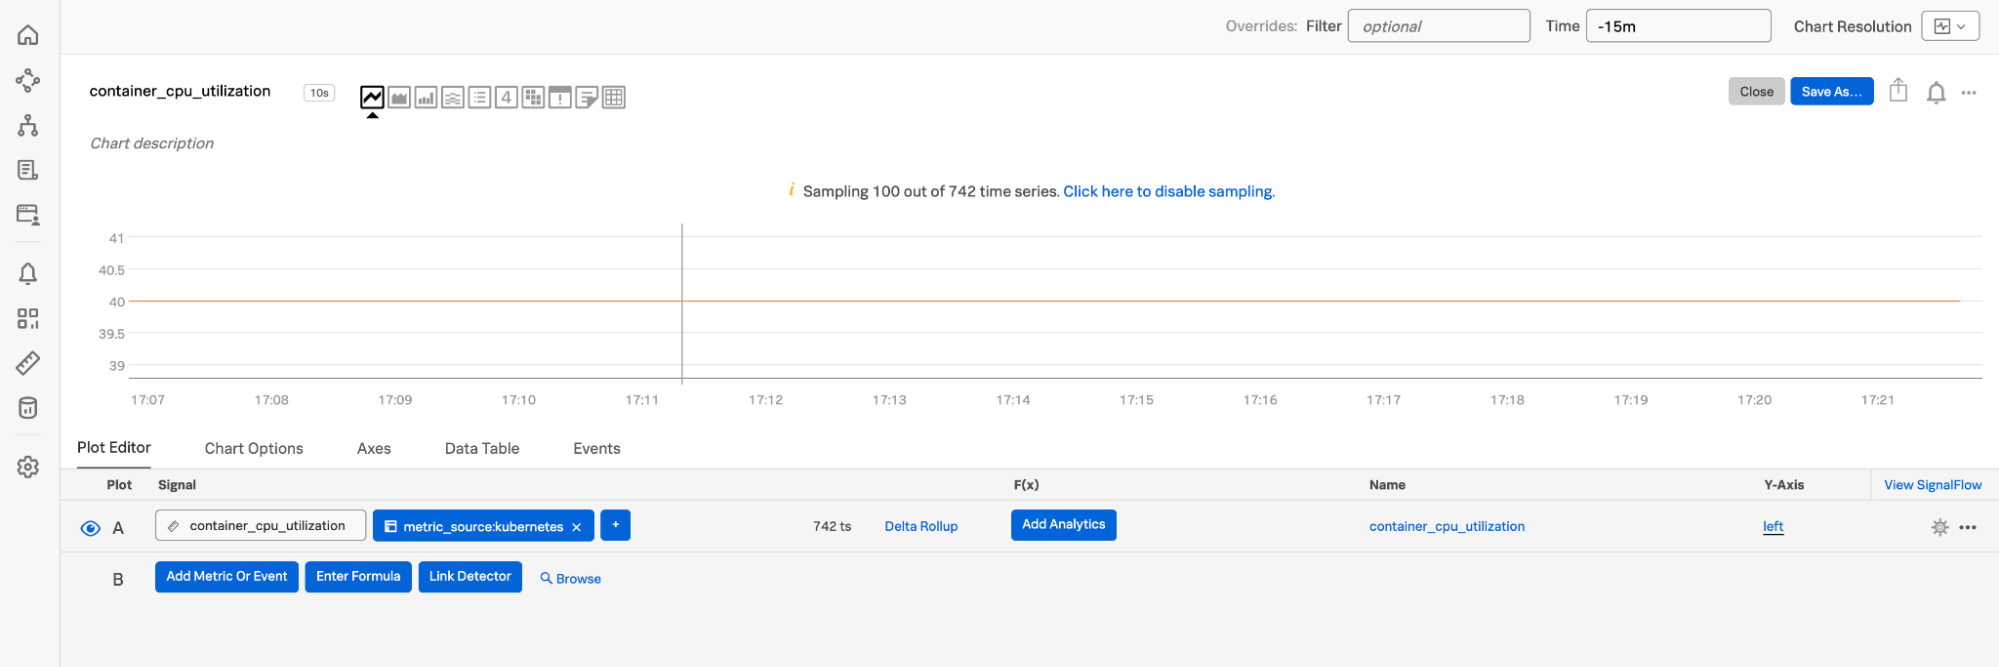
If you are unable to find any metrics (in the search results or there are no data points recently in the chart) from an integration configured to be monitored, go to the section on validating using logs.
Note
If metrics are found in the Metric Finder, but not seen in the chart for the time duration specified, they were reported at some point. Change the time duration specified to help look at logs at a specific timestamp.
Validate using logs 🔗
You can use logs to validate the Collector deployment. Use the following commands based on your environment:
For Docker:
docker logs my-container >my-container.log
For Journald:
journalctl -u my-service >my-service.log
For Kubernetes:
kubectl describe pod my-pod kubectl logs my-pod otel-collector >my-pod-otel.log kubectl logs my-pod fluentd >my-pod-fluentd.log
Check for the following errors:
Port conflicts: You might see a “bind:address already in use” error message. If you see this message, modify the configuration to use another port.
HTTP error codes indicating specific use cases:
401 (UNAUTHORIZED): Configured access token or realm is incorrect
404 (NOT FOUND): Likely configuration parameter is wrong like endpoint or path (for example, /v1/log); possible network/firewall/port issue
429 (TOO MANY REQUESTS): Org is not provisioned for the amount of traffic being sent; reduce traffic or request increase in capacity
503 (SERVICE UNAVAILABLE): Check the status page.
To confirm that a specific receiver is fetching metrics exposed by an application, update the configuration file, as shown in the following example.
Set the logging level to debug:
service:
   telemetry:
      logs:
         level: debug
Set log_data_points to true using the SignalFx exporter:
exporters:
   signalfx:
      ...
      log_data_points: true
      ...
After updating the configuration, restart the Collector. Check the logs for your environment to validate the deployment.
If you are unable to determine the issue from logs, see Splunk Observability Cloud support. Gather as much information as possible related to the environment, platforms, configuration, and logs.
1. Locate your existing Smart Agent configuration file 🔗
The Smart Agent can be configured by editing the agent.yaml file. By default, the configuration is installed at /etc/signalfx/agent.yaml on Linux and \ProgramData\SignalFxAgent\agent.yaml on Windows. If you override the location while installing the Smart Agent using the -config command line flag, the configuration file is stored at the location that you specify.
The following is an example YAML configuration file with default values where applicable:
signalFxAccessToken: {"#from": "env:SIGNALFX_ACCESS_TOKEN"}
ingestUrl: https://ingest.us1.signalfx.com
apiUrl: https://api.us1.signalfx.com

bundleDir: /opt/my-smart-agent-bundle

procPath: /my_custom_proc
etcPath: /my_custom_etc
varPath: /my_custom_var
runPath: /my_custom_run
sysPath: /my_custom_sys

observers:
   - type: k8s-api

collectd:
   readThreads: 10
   writeQueueLimitHigh: 1000000
   writeQueueLimitLow: 600000
configDir: "/tmp/signalfx-agent/collectd"

monitors:
   - type: collectd/activemq
      discoveryRule: container_image =~ "activemq" && private_port == 1099
      extraDimensions:
         my_dimension: my_dimension_value
   - type: collectd/apache
      discoveryRule: container_image =~ "apache" && private_port == 80
   - type: postgresql
      discoveryRule: container_image =~ "postgresql" && private_port == 7199
      extraDimensions:
         my_other_dimension: my_other_dimension_value
   - type: processlist
4. Estimate resource utilization (sizing) for the production environment 🔗
The sizing of the Collector and the corresponding VM or host it is to be deployed to should be based on the telemetry being collected. The Collector requires 1 CPU core per:
15,000 spans per second
20,000 data points per second
10,000 log records per second
The Smart Agent has an internal metrics monitor that emits metrics about the internal state of the agent. This is useful for debugging performance issues with the Collector and to ensure that the Collector isn’t overloaded. Add the following to your Smart Agent configuration file:
monitors:
   - type: internal-metrics
Note that this addition to your Smart Agent configuration file is only necessary to verify the data being sent through the Smart Agent. The Smart Agent configuration file is deleted when you deploy the Collector to a production host using the updated configuration file.
After the configuration file is updated, restart the Smart Agent.
You can then use the sfxagent.datapoints_sent and sfxagent.trace_spans_sent metrics to estimate the number of data points and spans being sent to Splunk Observability Cloud respectively. You can plot them on a dashboard and filter based on dimensions to ascertain the total per cluster or host.
Note
The sizing recommendation for logs also accounts for td-agent (Fluentd) that can be activated with the Collector.
If a Collector handles both trace and metric data, then both must be accounted for when sizing. For example, 7.5K spans per second plus 10K data points per second would require 1 CPU core.
Use a ratio of 1 CPU to 2 GB of memory. By default, the Collector is configured to use 512 MB of memory.
Configure the memory_limiter processor on every Collector instance, as shown in the following examples:
processors:
   memory_limiter:
      check_interval:
      limit_mib:
      spike_limit_mib:
Note
Define the memory_limiter processor as the first processor in the pipeline, immediately after the receivers.
5. Deploy the Collector to the non-production environment using the updated configuration file 🔗
Complete the necessary updates and translation of the configuration file, and restart the Collector on the non-production environment using the updated file.
Restart the Collector 🔗
On Linux:
sudo systemctl restart splunk-otel-collector
On Windows:
Stop-Service splunk-otel-collector
Start-Service splunk-otel-collector
On Kubernetes:
helm upgrade my-splunk-otel-collector --values my_values.yaml splunk-otel-collector-chart/splunk-otel-collector
After the Collector is restarted successfully, validate the deployment to make sure data is being collected and that there are no errors with the updated configuration file.
6. Deploy the Collector to a production host using the updated configuration file 🔗
After successfully deploying the Collector to a non-production environment and verifying that data is getting into Splunk Observability Cloud as expected, as a first step, stop and uninstall the Smart Agent from a single production host or VM to begin the migration. Follow the commands below for each respective environment:
On Linux:
For Debian-based distributions, including Ubuntu, run the following command:
sudo dpkg --remove signalfx-agent
For Red Hat, CentOS, and other RPM-based installs, run the following command:
sudo rpm -e signalfx-agent
On Windows (installer):
Uninstall the Smart Agent from in the Control Panel.
On Windows (ZIP file):
Run the following PowerShell commands to stop and uninstall the signalfx-agent service:
SignalFxAgent\bin\signalfx-agent.exe -service "stop"
SignalFxAgent\bin\signalfx-agent.exe -service "uninstall"
After uninstalling the Smart Agent, deploy the Collector to a production host using the updated configuration file and then validate the deployment of the Collector.
After verifying with one host, deploy the Collector with the same configuration to the rest of the hosts.
If you are a Splunk Observability Cloud customer and are not able to see your data in Splunk Observability Cloud, you can get help in the following ways.
Available to Splunk Observability Cloud customers
Submit a case in the Splunk Support Portal .
Contact Splunk Support .
Available to prospective customers and free trial users
Ask a question and get answers through community support at Splunk Answers .
Join the Splunk #observability user group Slack channel to communicate with customers, partners, and Splunk employees worldwide. To join, see Chat groups in the Get Started with Splunk Community manual.