Splunk On-Call incident frequency report 🔗
The goal of our Incident Frequency Report is to give your team the data and context around incidents to be proactive in your incident management response.
Requirements 🔗
This integration is compatible with the following versions of Splunk On-Call:
Enterprise
While the Splunk On-Call Timeline gives you the real-time information to give your team full context during a firefight, use the incident frequency report to analyze the flow of incidents after the fact.
To access the Incident Frequency Report go to Reports then Incident Frequency.
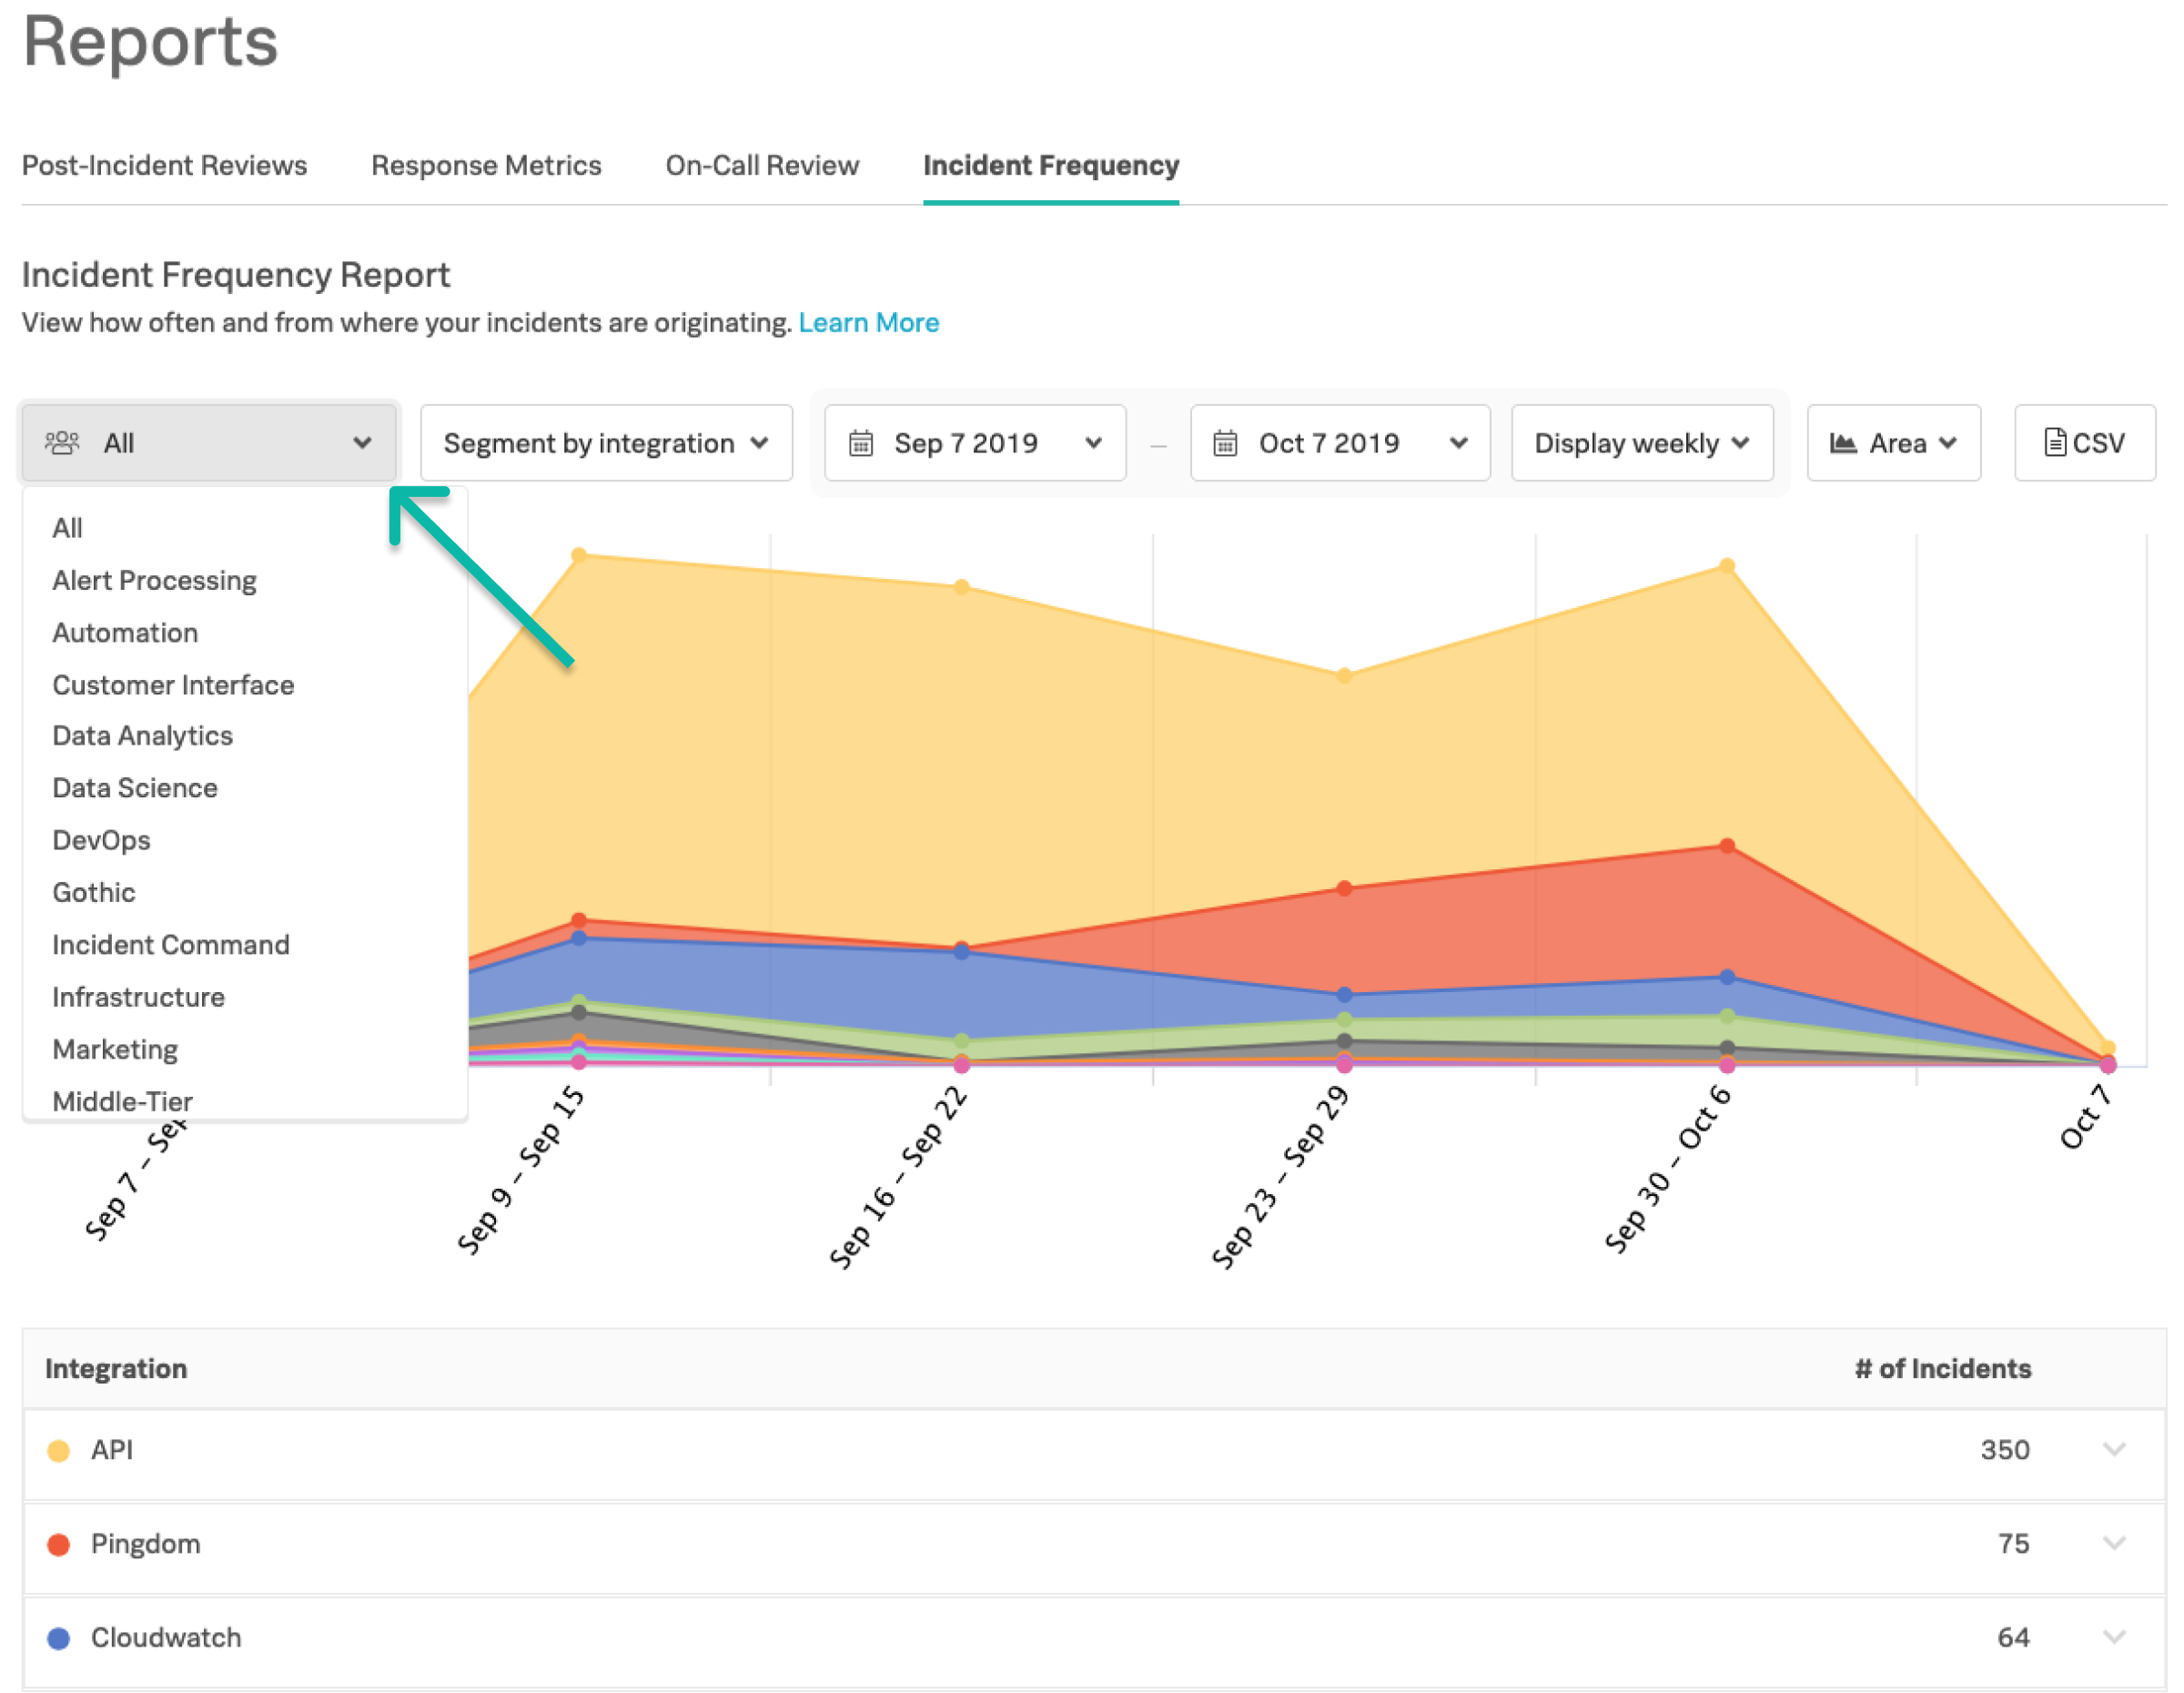
Team filtering 🔗
Get a holistic overview of all incidents coming into Splunk On-Call by selecting the All, or take a deep dive into individual teams to uncover specific problem areas affecting your team.
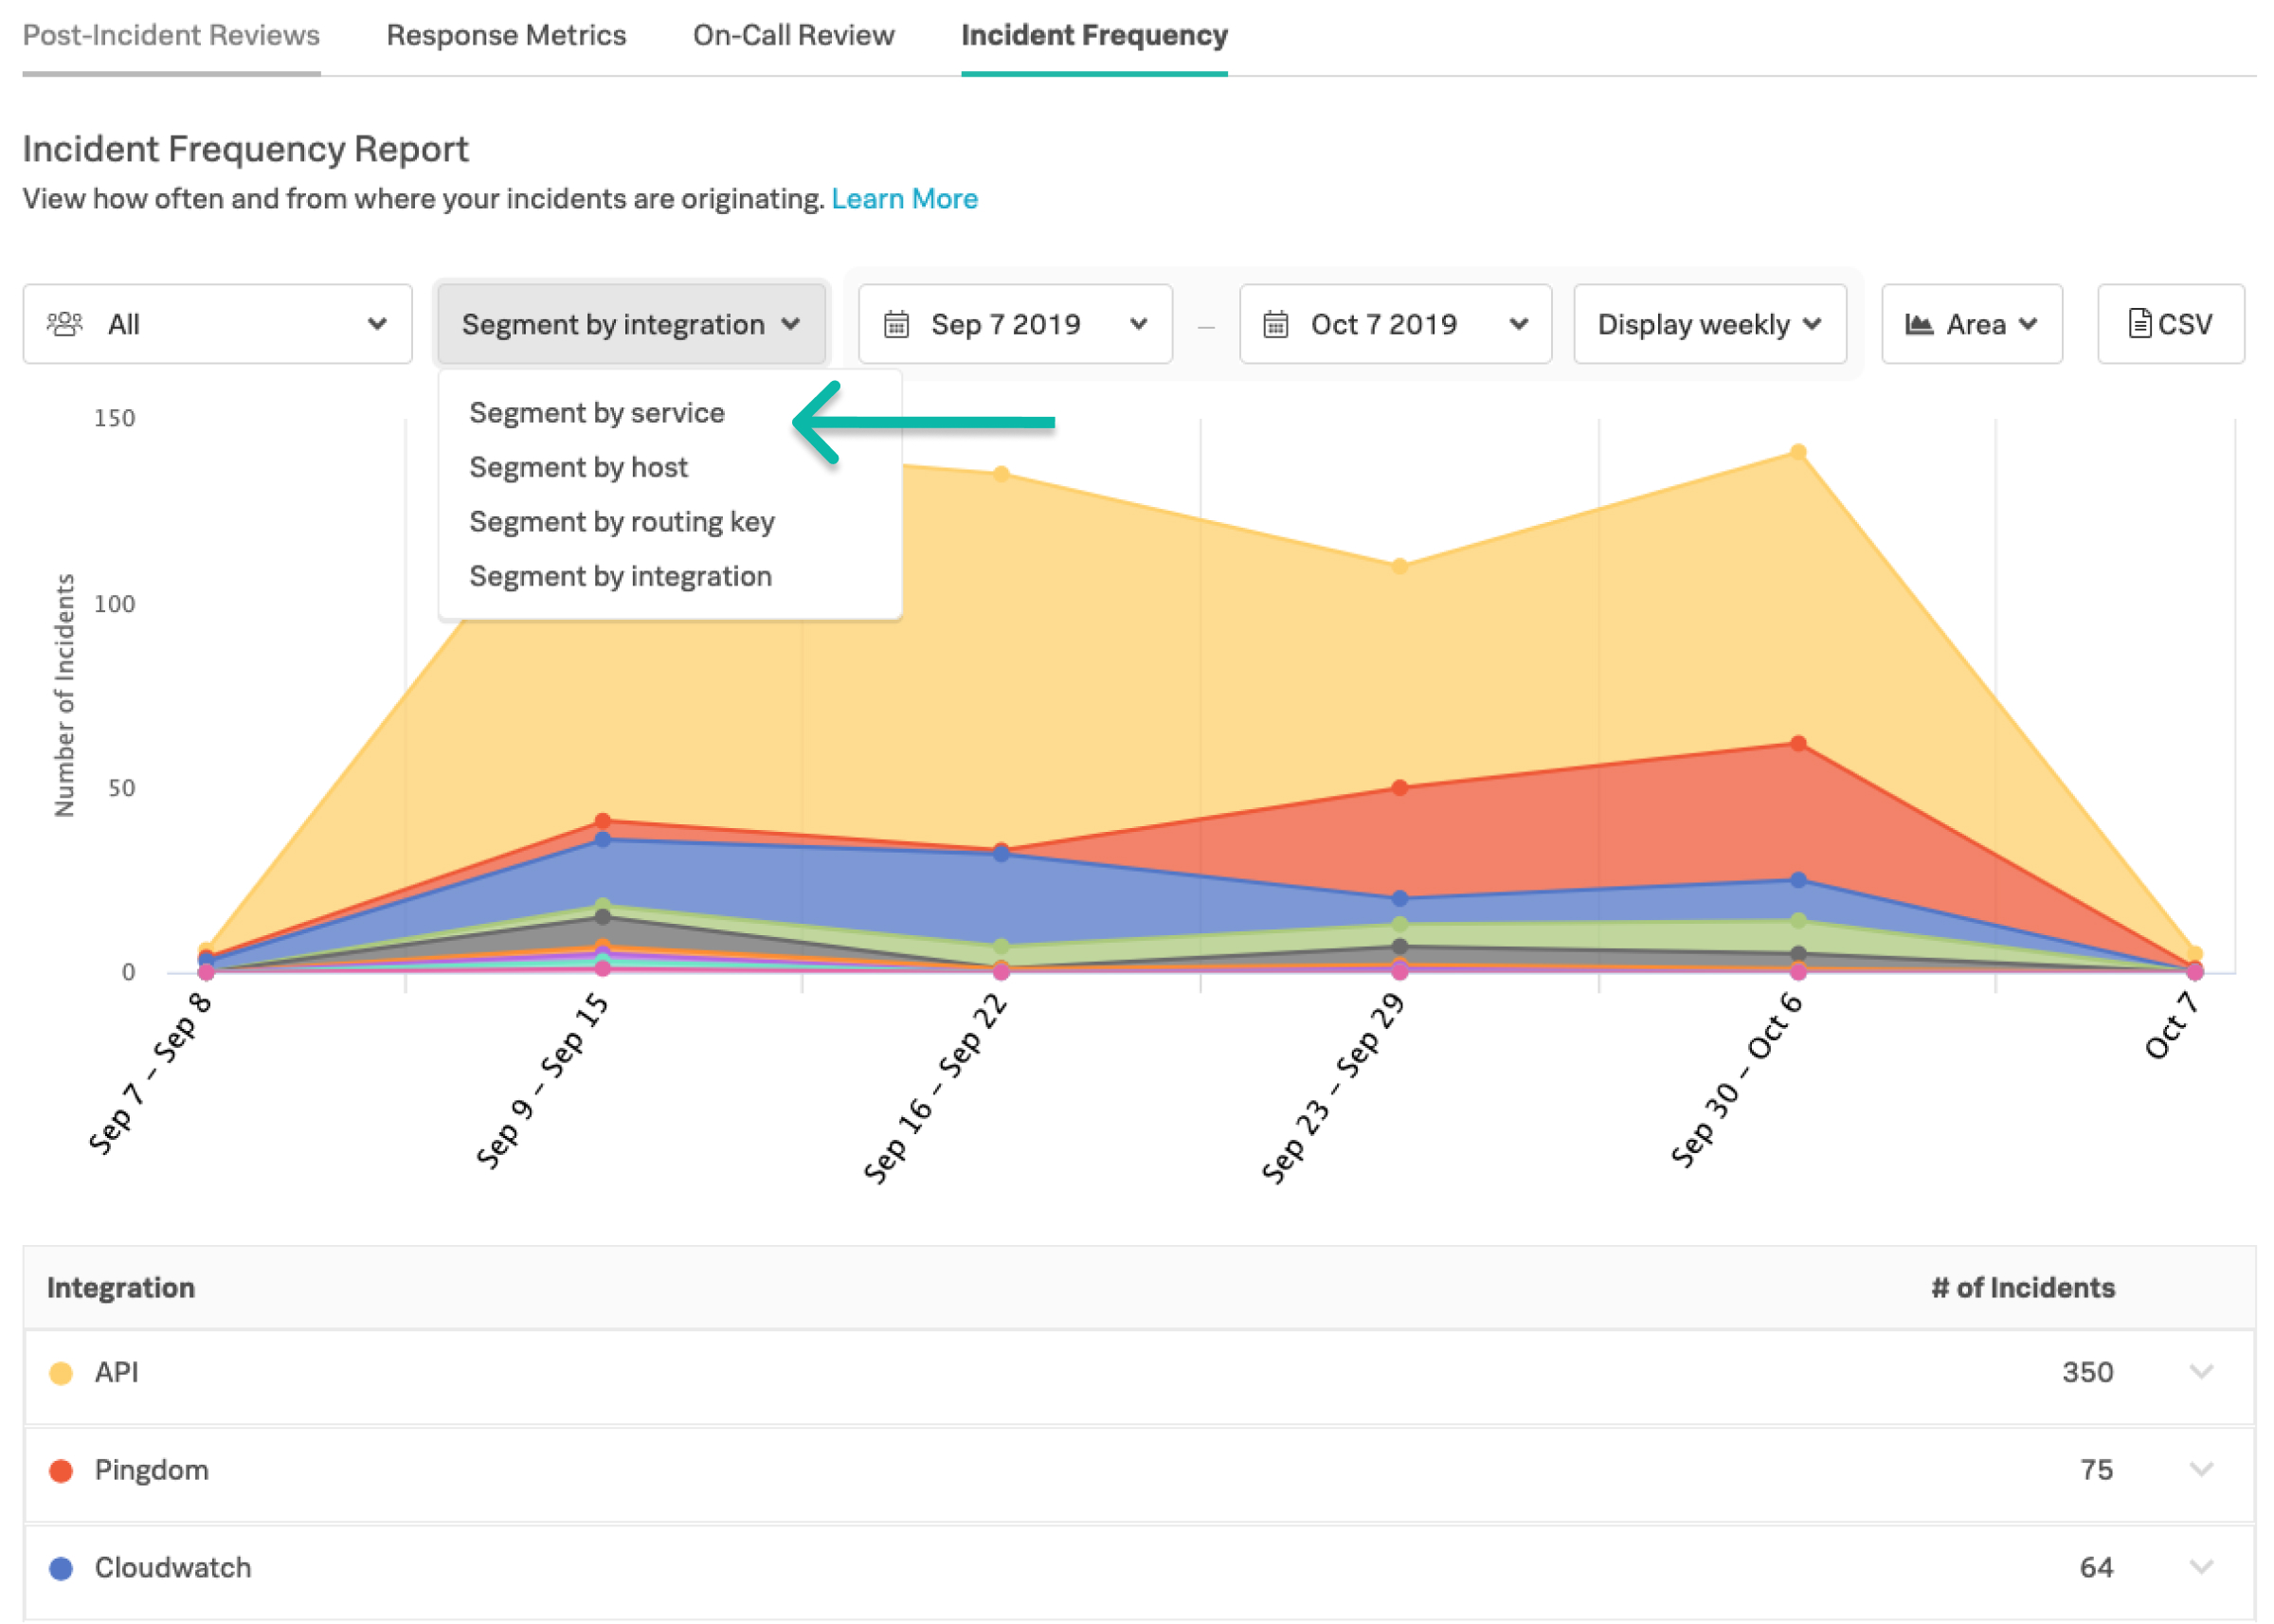
Segmenting 🔗
Identifying the problem causing area is hard to pin down, so we give you the ability to identify flapping alerts, the parts of your platform that need attention, and the information to understand from where your incidents are coming. We give you four options to segment your incidents: integrations, host, service, or route key.
Date range and bucketing 🔗
See how incident trends impact your team on a daily, weekly, or monthly basis. It’s up to you how granular your scope can be.
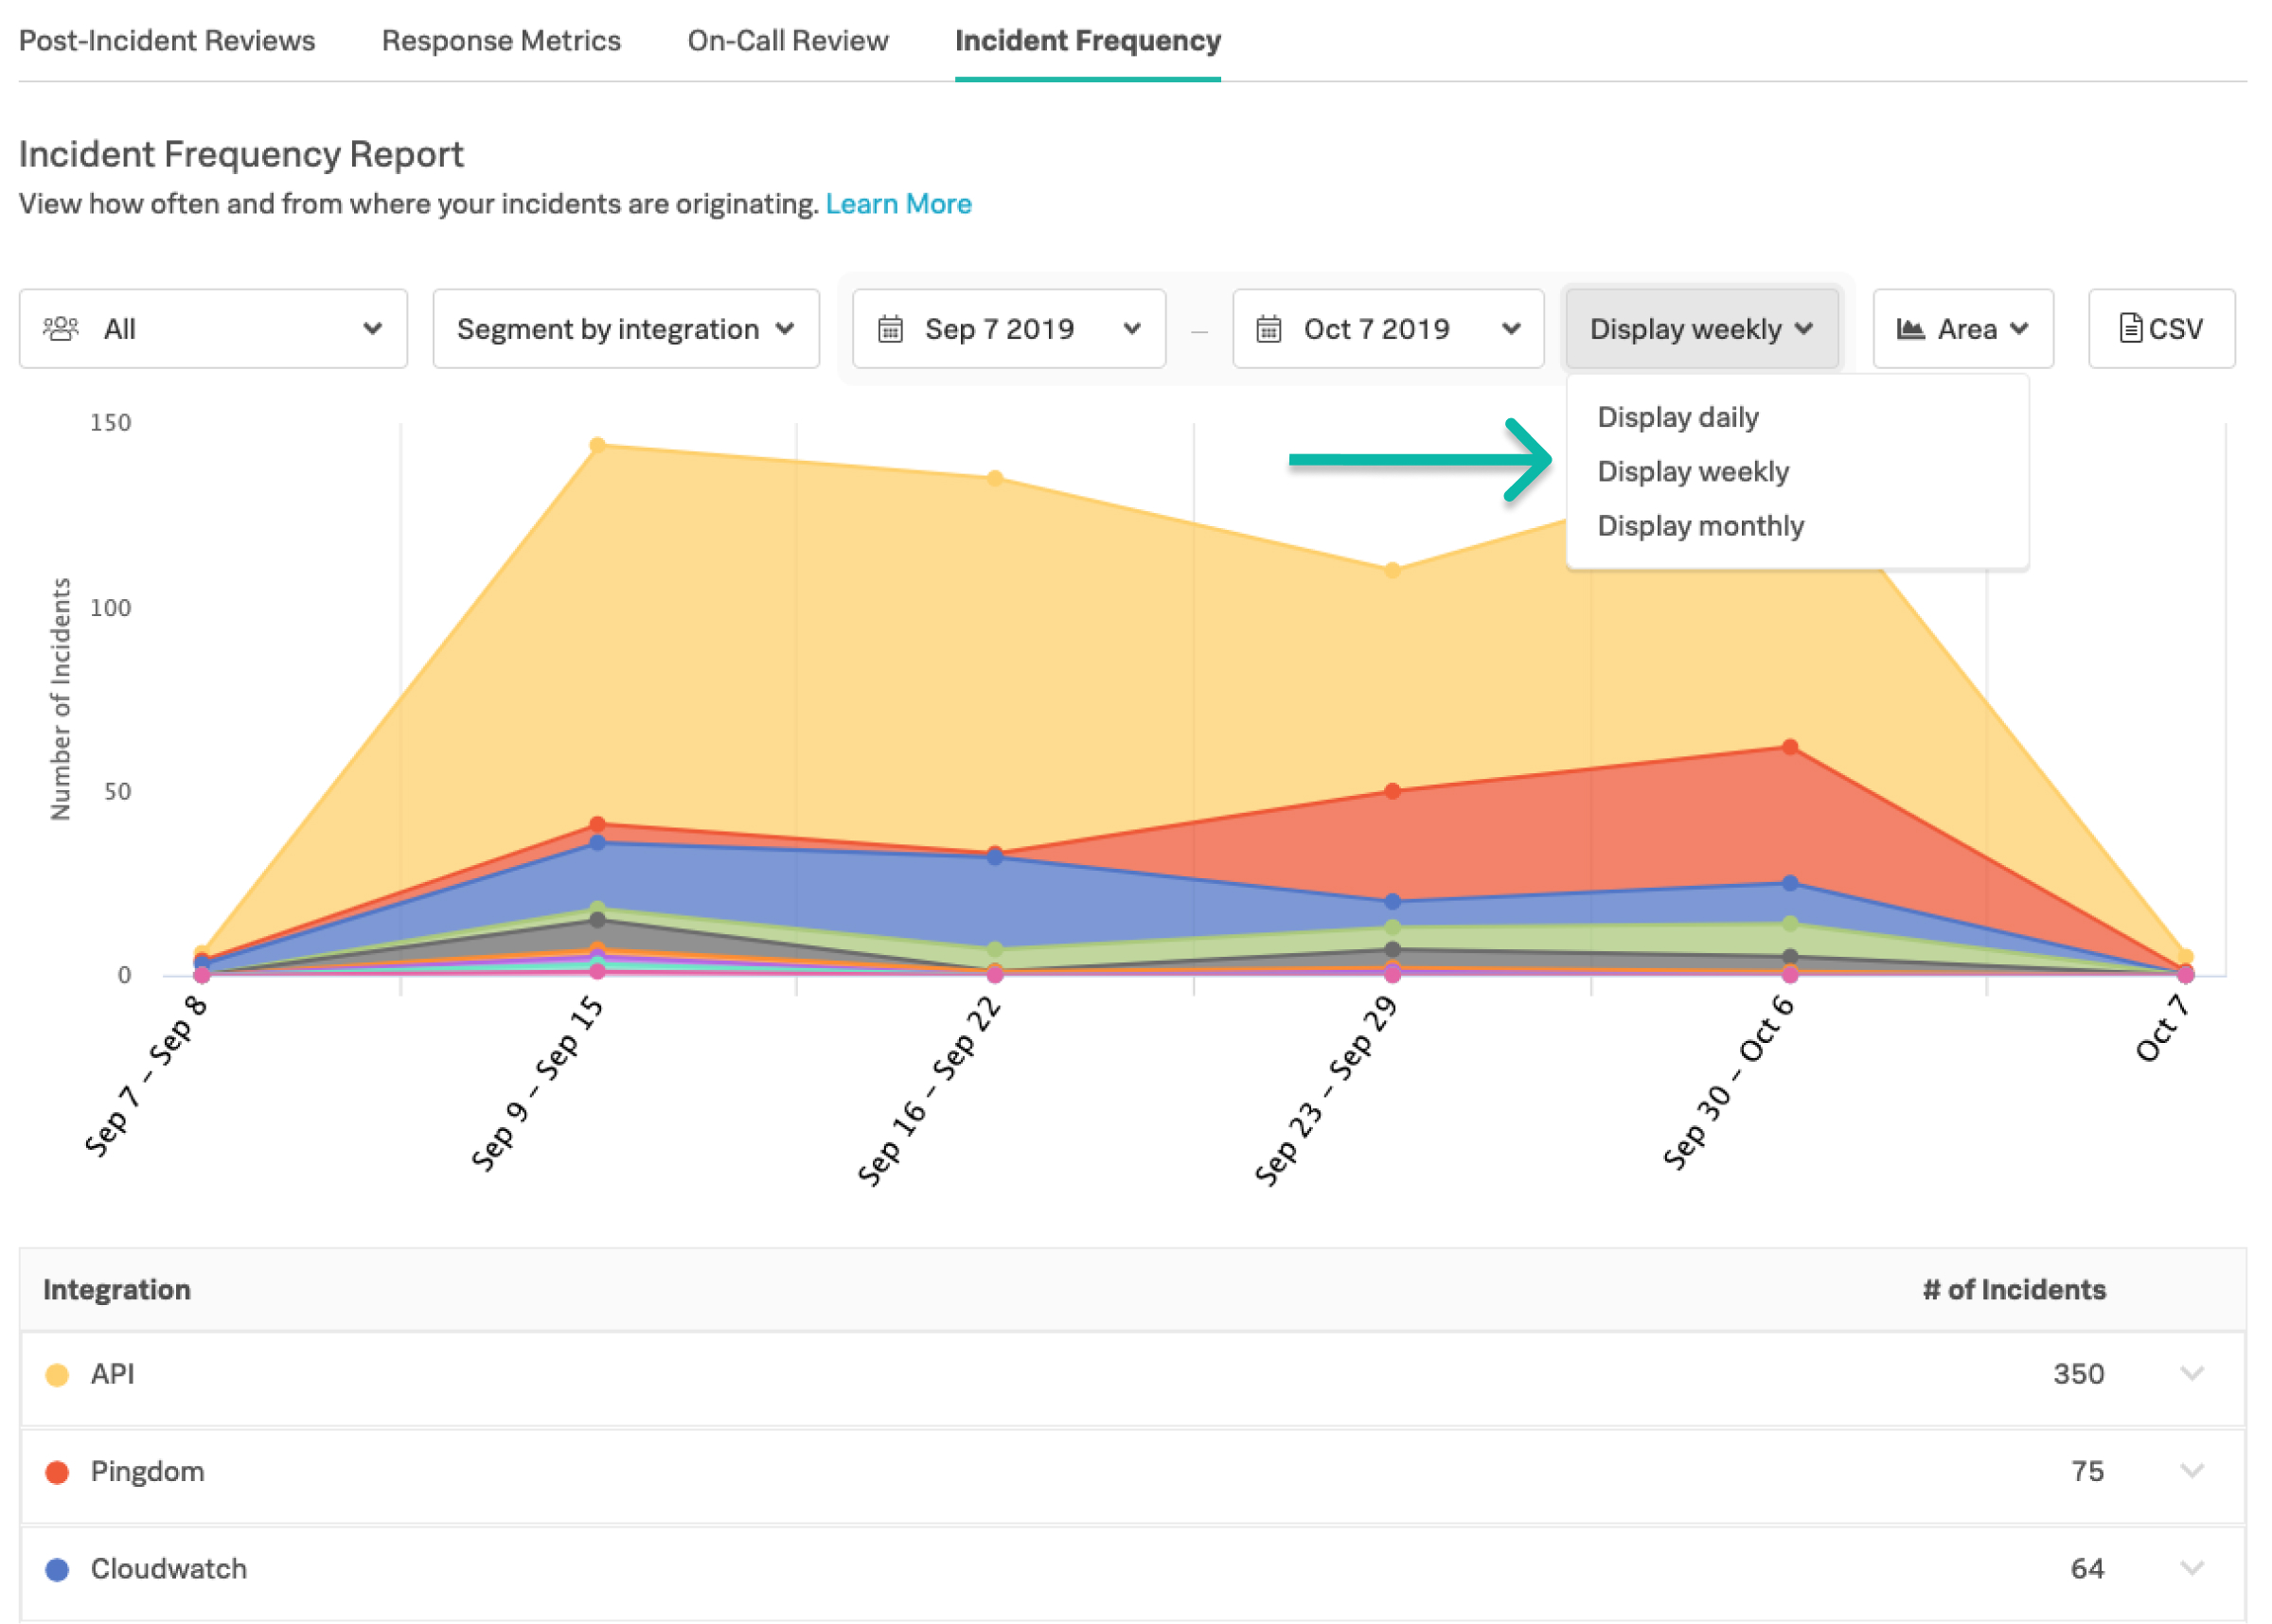
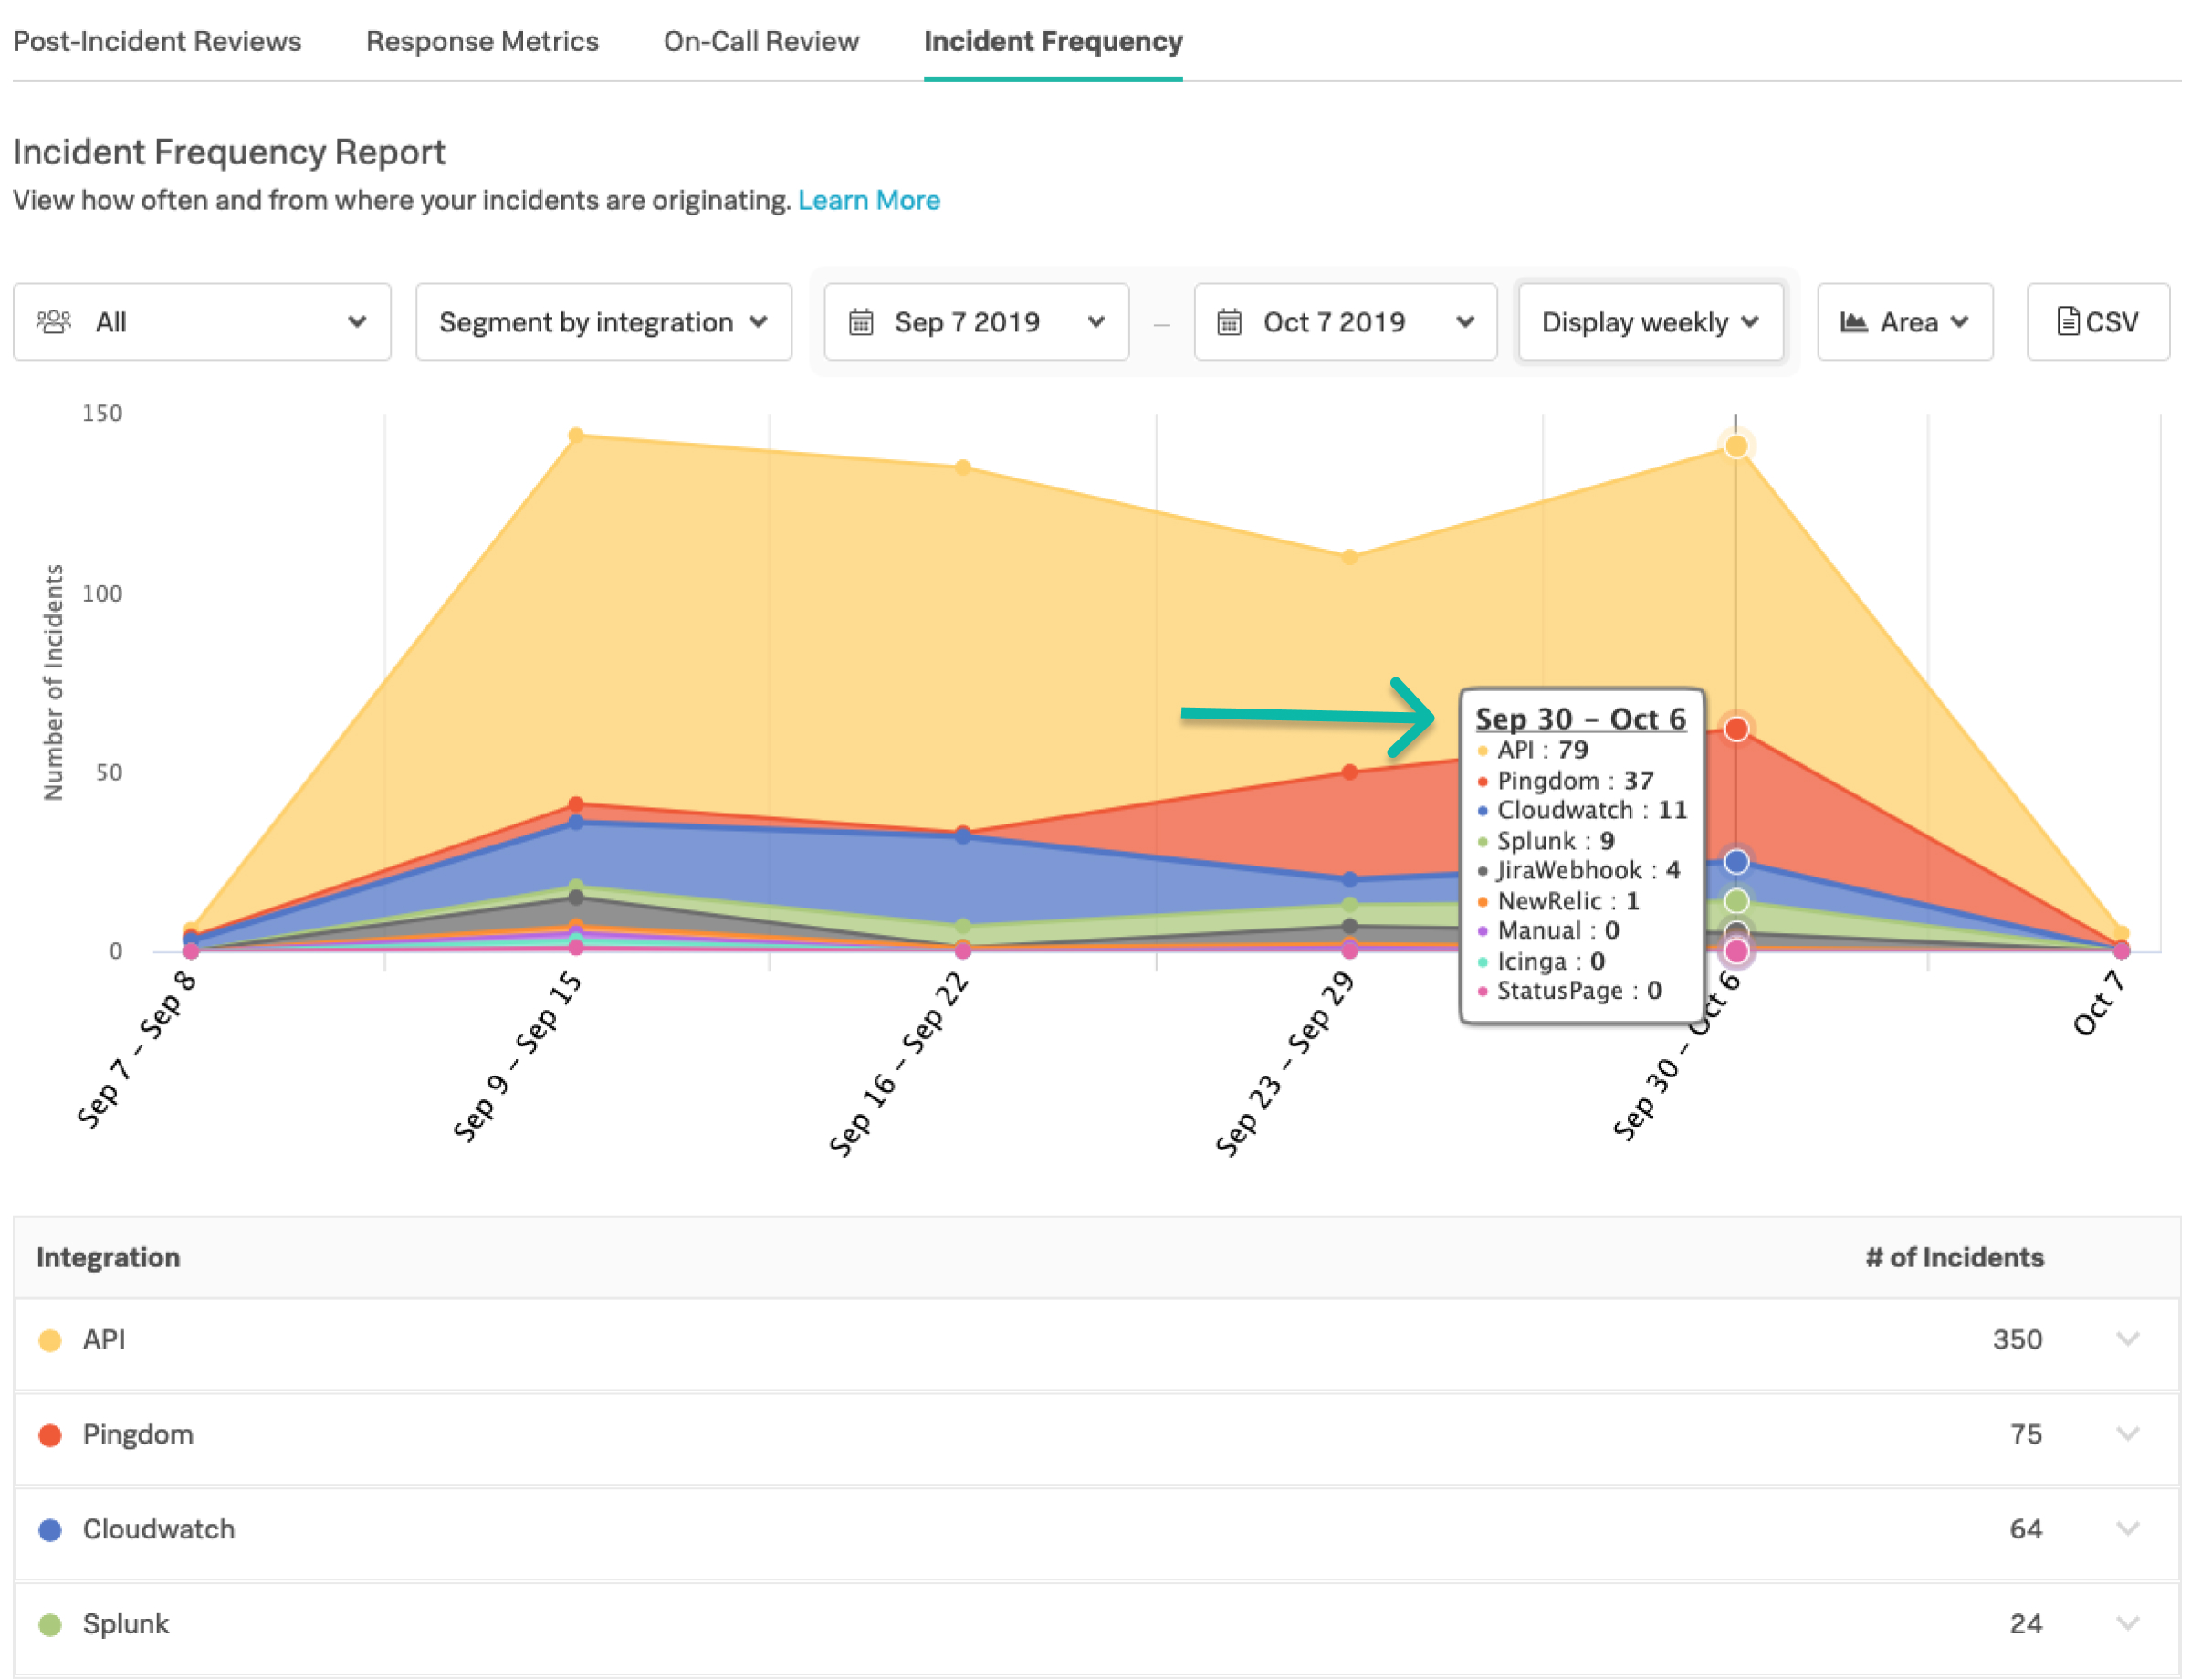
Table view and hover state 🔗
The table view will adjust to match the top 15 most frequent incidents associated with the selected segment filter.
To see the Hover State, hover over any position on the graph, and a pop-up will give you information for that given period of time. By selecting that hover state, the table below will focus on the selected time period to highlight what happened during a specific period of time dependent on your time bucketing selection. You can reset the table view by selecting the Reset button. Note: Hover state selection will not affect the contents of the CSV. To segment the CSV by a specific date range, adjust the date range rules.
CSV Download 🔗
The data delivered in the CSV will always reflect the date range andteam segmenting designed in the setting views. Changing the segment by filters and date range bucketing will have no effect on the contents of the download.
Things to note about the CSV:
Timestamps are at millisecond granularity
CSV is sorted by Incident ID in descending order
CSV file column headings 🔗
When downloading the Incident Frequency CSV file you can expect to find the following columns to include the unit of time/timezone that the incident is recorded in. Time related column headings will appear in these formats:
Time to Acknowledge (seconds) Time to Resolve (seconds) Incident Start Time (UTC) Acknowledge Time (UTC) Resolve Time (UTC)
Incident frequency report: CSV field definitions 🔗
The following is a quick glossary to define fields in the IFR CSV download. These definitions sometimes differ from the Glossary of Incident Fields.
Field |
Definition |
|---|---|
Incident number |
The unique numeric tag of the entity_id life cycle. |
Paged teams |
Teams paged by a triggered incident. |
Paged escalation policies |
Escalation policies paged by a triggered incident. |
Paged users |
Specific users paged by a triggered incident. |
Entity ID |
Central identifier for incident: entity_id. |
Entity display name |
More succinct, intruitive name for incident that does not effect the entity_id: entity_display_name. |
Routing key |
Used to direct incidents to a specific team: routing_key. |
Monitoring tool |
Defined integration. |
Service |
The type of check within a monitoring tool. Built from the entity_display_name field. |
Host |
Specific location of problem. Built from the hostname or host_name fields. |
Entity type |
Field for specific legacy integrations. |
Last Alert ID |
ID: VO_UUID. |
Number of alerts |
Alert count as depicted on the incident card. |
Number of alerts |
Alert count as depicted on the incident card. |
Incident start time |
First paged time. |
Triggered time |
The time of receopt by Splunk On-Call endpoint: VO_ALERT_RCV. |
Acknowledged time |
Time of Ack’d incident. |
Resolved time |
The time of Resolved incident. |
Acknowledged by |
Displayes the username who has acknowledged this incident: ack_author. |
Resolved time |
The time of resolved incident. |
Resolved by |
Displays the userame who has resolved this incident. |
Last alert time |
The time of the last alert. |
Current phase |
The state of incident: Triggered, Ack’d, Resolved |