Creating a post-incident review report 🔗
The post-incident review report from Splunk On-Call allows you to gain historical insight on events surrounding a particular incident or range of time, so the next time a similar situation arises, you have a documented account of how you solved the problem. We believe it’s important to not just catalog what happened in an incident, but to analyze the event in its entirety, and define actionable steps that help a team or organization dive deeper into the data.
To create a Post-Incident Review Report, access the Splunk On-Call web portal, and then select Reports.
Select the Post-Incident Reviews option and select New Report. Enter a title and select Create Report.
Configuring post-incident review reports 🔗
Once you’ve created a New Report, you’ll enter the main report configuration page where you’ll be able to provide and define context for your team about the effects of an incident. Here you’ll give the report a title, set a date range, limit or share editing privileges, and select whether or not an incident impacted customers. You may even create detailed Action Items to serve as guidelines for future incident management. Gather and add action items so that your team can take steps to learn from the current incident and improve your response in the future.
Currently, the report date-range data return is limited to four-month increments. Once the Report range is defined, all timeline events that occurred during that period will populate in the report builder.
Narrowing the scope of post-incident review reports 🔗
You may filter by Message Types including System Actions and Chat Messages, or by Routing Keys.
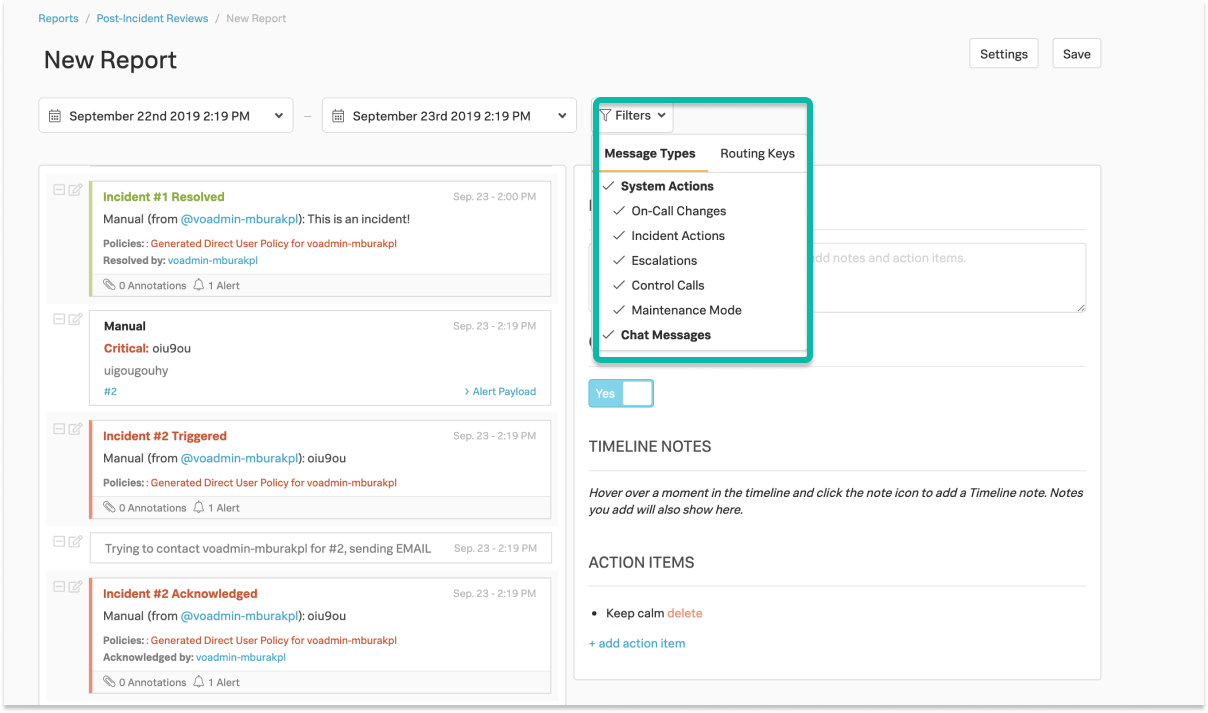
You may hide any alert, action, or post by selecting the remove or minus (–) button on the left side of the report builder.
Additionally, you may add notes to any alert, action, or post by selecting the note pad and pencil icon just to the right of the remove or minus (–) button. These notes will appear beneath the specific event card where the notation is assigned to help form a high-level analysis of what happened during an incident or event.
Note
The summary field and timeline notes support the markdown library described on this page: Mastering Markdown .
By selecting Alert Payload you may reveal the fields and values associated with a particular incident card.
Annotations through the Alert Rules Engine will also surface in the Post-Incident Report.
Once your Post-Incident review report is complete, select Save the top right corner. After the report is created it can be printed, turned into a PDF, or opened again for further editing.