Getting Google Cloud Platform data into the Splunk platform
Introduction
When it comes to getting data from Google Cloud Platform (GCP) resources into Splunk (Cloud or Enterprise) there are a number of possible data ingestion paths. Each one presents different characteristics in terms of scalability, security, performance, data support and management.
It is important to consider the trade offs when choosing the solution for each workload. It is also possible to leverage more than one solution.
Throughout this document, we will explore the different architectures, specifically focusing on the pull-based and push-based methods, to empower you in selecting the best solution for your specific use case.
Architecture diagram
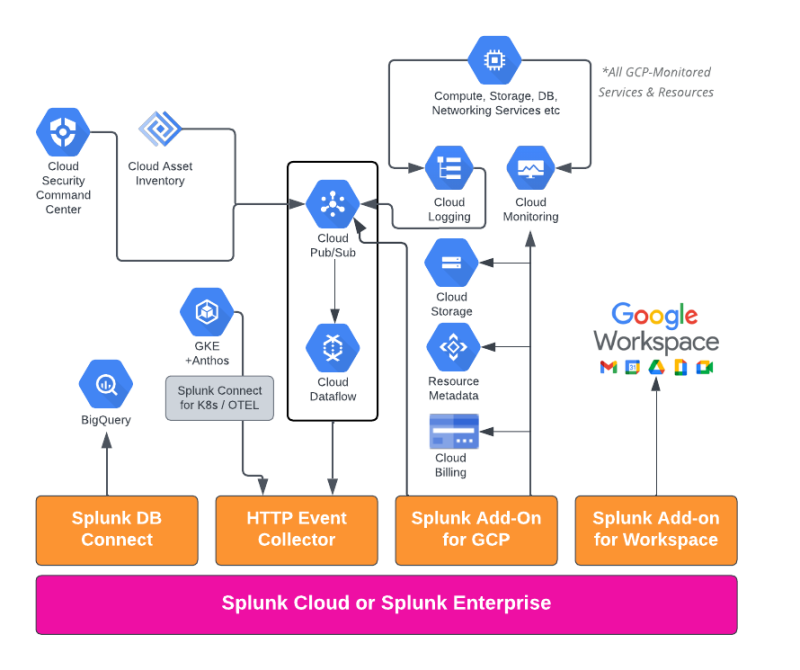
The following diagram represents the different data ingestion paths for GCP.
This diagram doesn't show an exhaustive list of data sources, but it is representative of the main integration points.
Note: Google Workspace is not part of Google Cloud Platform, but it is a Google Cloud Service, so it is also represented here.
This document covers the Splunk Add-on for GCP and Event Streaming via HTTP Event Collector. For additional information, refer to the Splunk DB Connect App and Splunk Add-on for Google Workspace.
Architecture options
There are two main ways of ingesting GCP data:
- Pull method: Use the Splunk Add-On for GCP to pull data from the GCP data sources via API calls
- Push method: Use HEC (HTTP Event Collector) as the entry point to push data from the GCP data sources to Splunk (Cloud or Enterprise) over HTTP/S
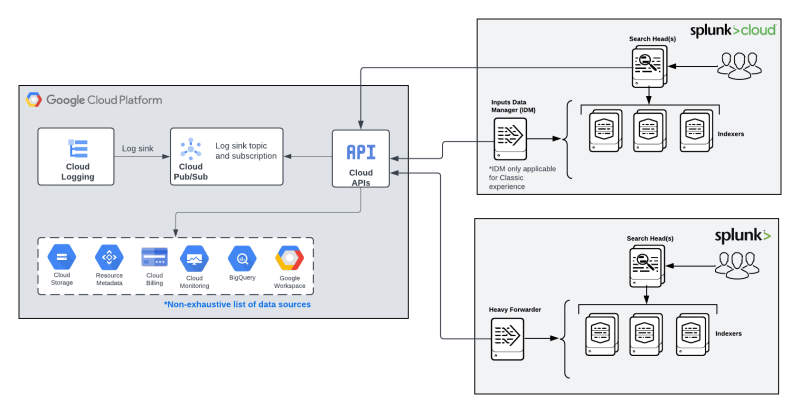
Please refer to the high-level architecture diagrams below, which illustrate both methods.
Pull based method
All GCP-Monitored services and resources centralize logs and metrics data on Cloud Logging and Cloud Monitoring respectively.
Log data can be sent from Cloud Logging to Cloud Pub/Sub via a data sink. Cloud Pub/Sub is a messaging system that works on a publisher/subscriber model, so once the logs are published to a topic, subscribers can read the data from the topic.
To log data, the Splunk Add-On for GCP supports the collection of billing data, resource metadata and Google Cloud Storage (GCS) content/files. The Add-On calls the Google Cloud APIs based on the intervals and configurations defined by the Splunk Admin. Log data is made available in near real time, since the client (subscriber) is informed when there are new messages in the queue to be processed. There is no need to configure an interval for polling data.
The Splunk Add-On for GCP can be installed on both Splunk Enterprise or Splunk Cloud Platform. For Splunk Cloud Platform the Add-On is installed either on the Search Head tier for Victoria Experience, or in the Input Data Manager (IDM) for Classic Experience.
For Splunk Enterprise, the Add-On is installed in a Heavy Forwarder. For more information about installation and configuration of the Add-On, please refer to the Splunk Add-on for Google Cloud Platform documentation.
Push based method
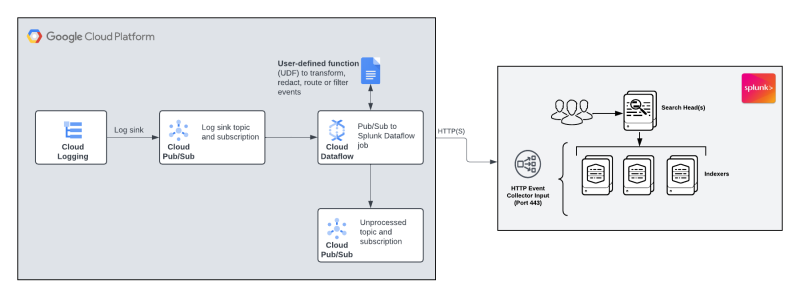
Similarly to the pull method, the push based method collects log data from PubSub and then uses Google Cloud Dataflow to stream data over HTTP(S) via HEC.
As shown in the diagram below, Cloud Dataflow allows users to define functions (UDF) to process/transform the data before sending it to Splunk.
It is also possible to define a queue for unprocessed data in the Dataflow pipeline. All messages that are not processed will be sent to this Pub/Sub queue and can be replayed by the user. The replay process is not automated, it is up to the administrator to resend the messages.
This architecture is exclusively used to send logs from GCP to Splunk. Metrics or other types of data are not supported.
Google Kubernetes Engine (GKE) is monitored by Cloud Logging and Cloud Monitoring by default, but it can also send K8's data to Splunk via HEC using Splunk OpenTelemetry Collector for Kubernetes or Splunk Connect for Kubernetes.
Both options are agent based solutions that collect not only log data, but also metrics, object metadata and traces (OTEL only). The agent collects data and pushes them to Splunk via HEC.
Important: The Splunk Connect for Kubernetes will reach End of Support on January 1, 2024. Splunk recommends migrating to Splunk OpenTelemetry Collector for Kubernetes, which is the latest evolution in Splunk data collection solutions for Kubernetes.
For additional information on Splunk OpenTelemetry Collector for Kubernetes, please visit the Splunk Validated Architecture page and click on the Splunk OTEL SVA.
Hybrid push and pull method
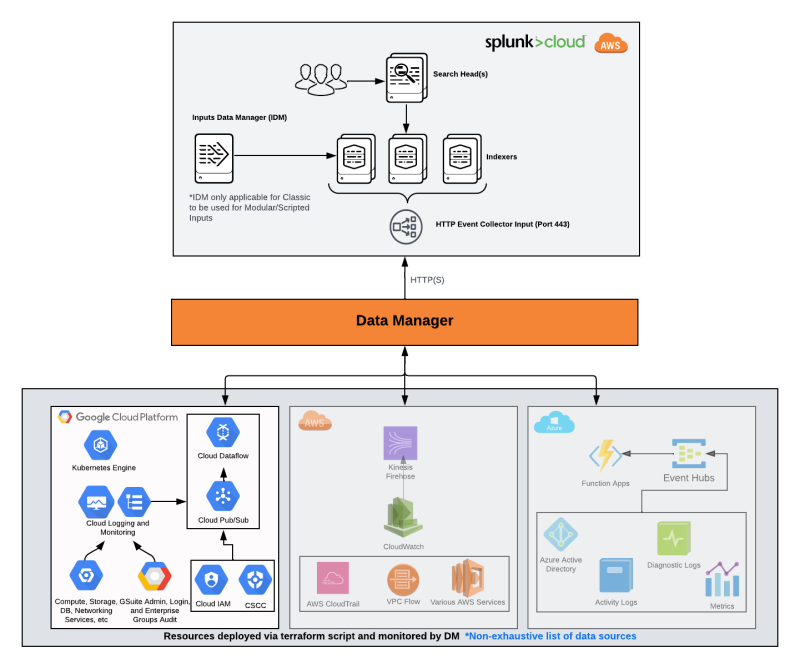
The other option to ingest GCP data is by leveraging Data Manager for Splunk Cloud. Data Manager provides a simple, modern and automated experience of getting data in for Splunk Cloud administrators, and reduces the time it takes to configure data collection (from hours/days to minutes).
Data Manager automates the initial data pipeline setup and configuration. It also allows Splunk admins to manage the pipeline health from an intuitive UI.
The diagram below highlights the GCP data sources, but Data Manager supports all the 3 main CSPs: GCP, AWS and Azure and is a great way to centralize data onboarding and troubleshooting for cloud data sources from a single pane of glass.
Data Manager is currently available only for Splunk Cloud Platform environments running on AWS. Depending on the data source and the Cloud Provider, Data Manager can use either the pull or the push method (or both). For GCP specifically, Data Manager currently supports the push model, using Cloud Dataflow to stream log data to Splunk Cloud via HEC.
Note: Although Data Manager uses the push method, it still doesn't support the use of UDF (user defined functions) out of the box. Customers can manually add UDFs on pipelines created by Data Manager.
Supported data sources
| Splunk Add-on for GCP | Event streaming via Cloud Dataflow | Data Manager | |
|---|---|---|---|
| Log data from all monitored services/resources | Yes | Yes | Audit logs and Access transparency logs only |
| Metrics | Yes | No | No |
| Resource metadata | Yes | No | No |
| Billing data | Yes | No | No |
| GCS content | Yes | No | No |
Common Information Model (CIM) support
The supported source types and correlation with CIM data models can be found in the Splunk Add-On for GCP documentation.
When sending data via Cloud Dataflow it is possible to configure in the pipeline template a parameter to include the entire PuSub message, making it compatible with the Splunk Add-On for GCP. For that reason, the same source types / CIM compliance apply to both.
Data Manager requires the Splunk Add-On for GCP to be installed to support the CIM normalization for GCP inputs (as documented in the pre-requisites for onboarding GCP data). Security
| Splunk Add-on for GCP | Event streaming via Cloud Dataflow | Data Manager | |
|---|---|---|---|
| Authentication/Authorization | Uses a Google service account* to pull data from GCP | Uses HEC Token to push data from GCP to Splunk Cloud | Uses HEC Token to push data from GCP to Splunk Cloud and a service account** to monitor the data pipeline |
| Token encryption | NA | Uses KMS (Secret Manager) to store the HEC token (google managed encryption key by default and customer managed optional) | Uses KMS (Secret Manager) to store the HEC token with Google managed encryption key. Customer managed encryption key is not available. |
| Data encryption in transit | Yes | Yes | Yes |
- The GCP service account used by the Add-On to gather data requires a lot of viewer and admin services' permissions. Check here the list of IAM roles/permissions required. Some customers have found that limiting permissions work in their environment (custom roles with the correct read-only permissions can be created instead of using predefined roles).
The service account is used at the project level, so if you plan to collect logs at the organization level, make sure to create an aggregated sink.
In order to configure the log export to Google Cloud Pub/Sub, there are other service permissions required, but this setup can be done by the GCP admin and will not require any Splunk intervention. The same applies to the billing export to BigQuery. Splunk will only collect the data once the pipeline is configured.
Data Manager uses a service account to monitor the health of the data pipeline. This service account has only read/viewer permissions for Cloud PubSub, Cloud Dataflow and Cloud Logging. The permissions are listed in the initial setup window.
Additionally, a service account with a much broader list of permissions will be required to setup the data pipeline. This step will be performed by the Google Cloud administrator using the terraform template created by Data Manager.
Availability and Resilience
Availability and Resilience have to be measured based on the end-to-end solution, meaning that both the GCP and Splunk Cloud components involved in sending/receiving data are part of the equation.
Splunk is responsible for the health of the Splunk Cloud components while the customer is responsible for the GCP components and the network connection between the GCP environment and Splunk Cloud. Check the architecture diagram in the Architecture Options section to visualize the components involved in each architecture.
Nodes involved in the collection or receiving end from the Splunk side might change depending on the Splunk Cloud Experience.
| Splunk Add-on for GCP | Event streaming via Cloud Dataflow | Data Manager | |
|---|---|---|---|
| Single point of failure | Splunk Cloud Classic:
Yes - IDM is a single machine Splunk Cloud Victoria: Yes, for single SH No, for SHC |
No. HEC endpoint balances the load across the indexers that are spread in different availability zones. | No. HEC endpoint balances the load across the indexers that are spread in different availability zones. |
| Message failure handling | Relies on Pub/Sub error handling | Relies on Pub/Sub and Dataflow error handling | Relies on Pub/Sub and Dataflow error handling |
Mechanisms to handle message failures are offered by both Google Cloud Pub/Sub and Google Cloud Dataflow, but those have to be configured by the customer in their GCP environment.
Find below some of the options:
Pub/Sub:
- Subscription retry policy: If Pub/Sub attempts to deliver a message but the subscriber can't acknowledge it, Pub/Sub automatically tries to resend the message. Enabled by default as "immediate redelivery". "Exponential backoff" is also an option.
- Dead-letter: If the subscriber client cannot acknowledge the message within the configured number of delivery attempts, the message is forwarded to a dead-letter topic and can be replayed. Not enabled by default.
- Retention duration: Unacknowledged messages are retained by default for 7 days (configurable by the subscription's message_retention_duration property). Retention duration can also be configured at the topic level and for acknowledged messages at the subscription level, but those are not enabled by default.
Dataflow: Dead-letter: Similarly to Pub/Sub, Dataflow can configure a dead-letter topic to allow the replay of undelivered messages. The current Dataflow template used to send data to Splunk requires that a dead-letter queue is configured, so this feature will be enabled by default when sending data via HEC.
Note: Pub/Sub dead-letter topics and exponential backoff delay retry policies are not fully supported by Dataflow, so they are not an option if you are sending data via HEC. Check this documentation to learn more about Building streaming pipelines with Pub/Sub, and its limitations.
Scalability
In terms of scalability, the push method is recommended when the volume of data to be transferred is high.
As per the Splunk Cloud Platform Service Description documentation, the pull based service limits (for modular and scripted inputs) are:
- Up to 500GB/day for entitlement of less than 166 SVC or 1TB
- Up to 1.5TB/day for more than 166 SVC or 1TB
This applies to the Splunk Add-On for GCP running on Splunk Cloud Platform with Victoria experience. For Classic experience, the Add-On runs on IDM instead of the Search Head (see Architecture Options - Pull Based method above) and the limitation in this case is tight to the machine resources (CPU/memory). IDM will be monitored by Splunk and Splunk will use telemetry to determine if additional capacity is justified to ensure customer experience.
The documentation for the Splunk Add-On for GCP provides a rough reference of throughput for a specific hardware/machine type. If configuring the Add-On in a Heavy Forwarder, this can be a helpful metric, but it is important to keep in mind that there are other variables involved in the solution that can influence the performance results.
The push method (which applies for Event streaming via Cloud Dataflow and Data Manager) sends data via HEC and all the load is balanced across the indexers. HEC scales horizontally with your indexing tier allowing you to grow your agentless indexing footprint in parallel with your forwarders. Staying close to your ingest patterns and planning for future capacity and new use cases is advised.
On the GCP side, Cloud Pub/Sub is a fully managed and highly scalable service and Cloud Dataflow will auto-scale based on the number of workers defined in the template. The Pub-Sub to Splunk template allows the configuration of the maximum number of workers and will auto-scale respecting this limit. To properly size the Cloud Dataflow pipeline, refer to the section Planning Dataflow Pipeline Capacity of the Deploying production-ready log exports to Splunk using Dataflow article. This document also explains the rate-controlling parameters (batchCount and parallelism) that can be configured to prevent the downstream Splunk HEC endpoint from being overloaded.
Splunk Data Manager sets all the pipeline parameters for you as part of the terraform script. The parameters are set based on tests performed for optimal performance and cost for customers ingesting up to 5TB/day.
Management
| Splunk Add-on for GCP | Event streaming via Cloud Dataflow | Data Manager | |
|---|---|---|---|
| Automated initial setup | No | Partially | Yes |
| Monitoring available | No | Partially | Yes |
The initial setup for the Splunk Add-On for GCP will require the configuration on the GCP side and the installation/configuration of the Add-On in the Splunk Cloud side.
The initial setup of the Event streaming via Cloud Dataflow is mostly done in the GCP side (except for the HEC token creation). You can manually follow the step by step instructions from this tutorial or use a terraform template to automate the deployment steps.
Data Manager automates the initial setup by creating a terraform template based on the configuration parameters provided by the user. Some GCP datasources have to be configured/enabled ahead of time and are part of the pre-requisites of the data onboarding process.
In terms of the data pipeline monitoring, the Splunk Add-On for GCP doesn't provide any health data. For Event Streaming via Cloud Dataflow the terraform deployment template includes an optional Cloud Monitoring custom dashboard to monitor your log export operations. This monitoring though is only on the GCP side. Check this article for more information on the dashboards and metrics available.
Data Manager provides a health dashboard showing information about the data pipeline and current status. Refer to the GCP Inputs Health documentation for more information about the dashboard.
Cost
There is no additional cost (other than the normal usage of resources for search/ingest data) on the Splunk side for ingesting GCP data from either the pull or the push method.
The cost from the GCP side can be broken down into the following main components:
- Google Cloud Operations Suite - Applies to both the pull and the push methods
- Google Cloud Pub-Sub - Applies to both the pull and the push methods
- Google Cloud Dataflow - Applies only to the push method
- Google Cloud Networking (for egress traffic) - Applies to both the pull and the push methods
- Google Cloud Storage (used to store UDF templates and template metadata) - Applies only to the push method
- Google provides a pricing calculator tool where you can generate a cost estimate based on your projected usage.
| Splunk OpenTelemetry Collector for Kubernetes | Getting Microsoft Azure data into the Splunk platform |
This documentation applies to the following versions of Splunk® Validated Architectures: current


 Download manual
Feedback submitted, thanks!