About the Splunk Dashboard Studio editors
Use the visual editor to create and edit dashboards. The visual editor provides access to an editing user interface and access to the JSON source code.
Visual editor
You can create and update dashboards in the visual editor. See Build, edit, and convert existing dashboards in the Splunk Dashboard Studio for more information.
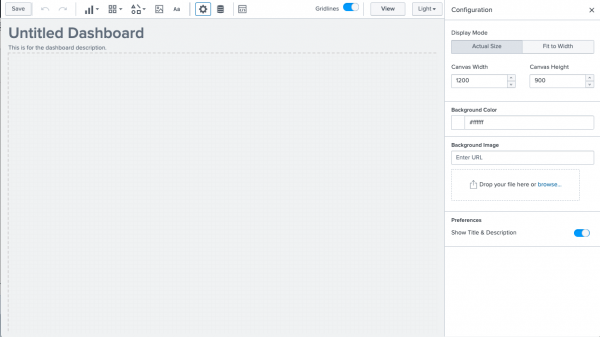
The following is a screenshot of the visual editor using absolute mode.
Source code editor
Use the source editor, also called the dashboard definition, to access and edit the JSON source code. For more information, see How the dashboard definition is structured in the source editor.
Example of the source editor
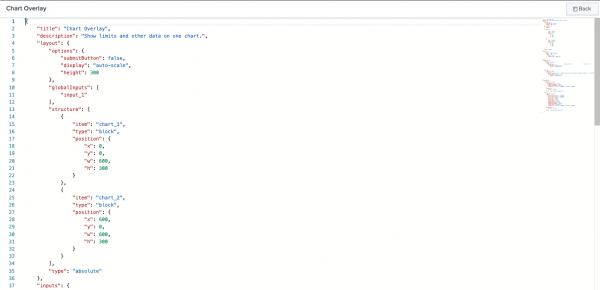
The following is an example of a dashboard definition in the source editor.
Access source code in the visual editor
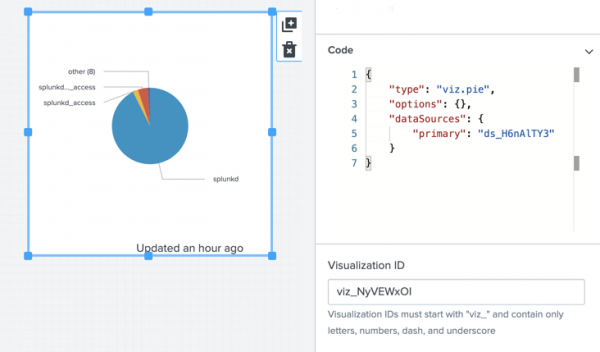
You can modify the source code of a visualization or data source in the visual editor by selecting the visualization or search and opening the Code window in the Configuration panel. The changes you make will instantly affect the visualization or data source you're working with. For example:
| Part 9 Polish up your dashboard | Build, edit, and convert existing and new dashboards in the Splunk Dashboard Studio |
This documentation applies to the following versions of Splunk Cloud Platform™: 8.2.2112


 Download manual
Feedback submitted, thanks!