How to format JSON stanzas
Every object on your canvas is defined in the format of a JSON-formatted stanza. Data sources, visualizations, inputs, defaults, and the layout all have similar hierarchies, but also some differences.
For example, you can give your data source stanza a name, separate from the unique ID, using the name property or give a visualization a title using the title property.
Using stanza punctuation
There are a few common rules when formatting JSON.
- When setting options in the
optionsproperty, boolean values and numbers do not require quotes. - Strings, such as plain text and hex color codes, must be wrapped in quotes.
- Arrays must be enclosed in brackets.
- Commas must come at the end of the line after each option entry except the last.
- The list of options you use must be enclosed in curly braces followed by a comma.
- Commas must separate each stanza in a section except for the last. For example, if there are three visualization stanzas in the visualization section of a dashboard definition, each stanza is separated by a comma after the last closing curly bracket, with the exception of the last visualization.
- Commas must separate each property setting except the last.
If you get formatting error messages, you can use one of the many JSON formatting websites to check your code to identify the error.
In the following example of a data source section, the stanza has the unique ID of ds_search_1. Two queryParametersoptions are used, set to earliest and latest, as well as two properties, refresh set to 10 seconds, and refreshType set to delay. The trailing comma assumes there is another data source stanza following the one in the example.
To learn more about data source options and settings, see Data source options and properties.
To learn more about visualization-specific options and properties, see the section for the specific visualization you want to access.
	"dataSources": {
		"ds_search_1": {
			"type": "ds.search",
                        "name": "my search",
			"options": {
				"queryParameters": {
					"earliest": "$TimeRange.earliest$",
					"latest": "$TimeRange.latest$"
				},
				"query": "index=_internal | top limit=100 sourcetype | eval percent = round(percent,2)",
                                "refreshType": "delay",
			        "refresh": "10s"
			},
		},
	},
Access source code in the visual editor
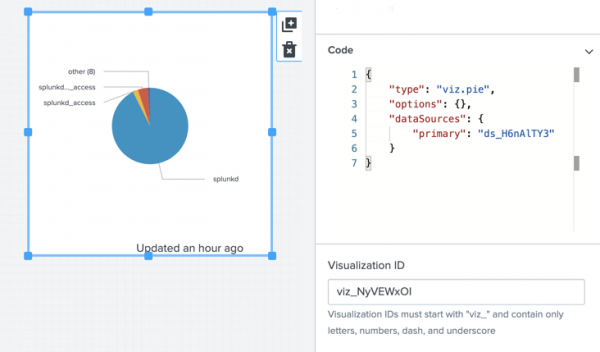
You can modify the source code of a visualization or data source in the visual editor by selecting the visualization or search and opening the code window in the Configuration panel. The changes you make will instantly affect the visualization or data source you're working with. For example:
| The source code stanza of a visualization | Create search-based visualizations with ds.search |
This documentation applies to the following versions of Splunk Cloud Platform™: 8.2.2112

 Download manual
Feedback submitted, thanks!