Use reports and saved searches with ds.savedSearch
Use the ds.savedSearch to bring in reports or saved searches within the Splunk Dashboard Studio or other apps. You can use the ds.savedSearch data source to schedule these searches to run on a particular frequency and store the results, which lightens processing loads and concurrent search limits. For example, if fifty users access a particular dashboard, panels backed by scheduled saved searches will not cause the searches to run fifty times, while panels backed by searches of the type ds.search might.
Dashboards in the Search & Reporting app that use reports transfer as JSON stanzas of type ds.savedSearch when you open them in Splunk Dashboard Studio.
If you have multiple saved searches in your dashboard, your dashboard only runs as many searches as your concurrency limit. Your limits.conf file lists concurrency limits for different types of searches. For example, if your concurrency limit is three and you have five saved searches, the first three saved searches in the queue run, but the last two don't. Concurrency limits prevent scheduled searches from queueing indefinitely.
For dashboards with more saved searches than the concurrency limit, use an ad hoc or inline search with the savedsearch command to call the saved search. An ad hoc or inline search creates a scenario where searches that exceed the concurrency limit still queue and run when capacity allows.
To learn more about inline searches, see Inline searches in the Dashboards and Visualizations with SXML manual.
For a list of settings for search concurrency limits, see Concurrency in the Admin Manual.
If you are using lookups in your search, make sure you've set the lookup permissions to "global".
Imported and built-in reports
You must reference a saved search or report by its exact name by using the ref property. To specify which app the saved search or report belongs to, use the app property. If no app is specified, Splunk assumes the report came from the app in which the dashboard resides.
Access saved searches that live in the Search & Reporting app
The following procedure shows you how to access a saved search that lives in the Search & Reporting app.
- Export your dashboard from the Search & Reporting app, or create a new one in Splunk Dashboard Studio.
- In the Search & Reporting app, find the report, or saved search, that you want to use.
You can find it in Settings > Searches, reports, and alerts. In this section, saved searches are called reports. Make a note of the exact names of the reports. The exact name must be set in therefoption of the data source stanza. You may want to use a text editor to keep track of the names. - Add a
ds.savedSearchstanza to the dashboard definition in Splunk Dashboard Studio.
You may want to change the unique ID to easily find it in the dashboard definition. Note the data source type isds.savedSearch. For example:"reportNoScheduleNoRefresh": { "type": "ds.savedSearch", "options": { "ref": "Top 100 sourcetypes in the last 24 hours" } },
The default assumption is that the saved search you're using lives in the app you're working in. If you created your saved search within any app other than Dashboard Studio, you must use the app option and set it to the app where the saved search was originally saved. For example, if you created a saved search in an app called "my-app", the stanza would look like the following:
"reportNoScheduleNoRefresh": {
	"type": "ds.savedSearch",
	"options": {
		"ref": "Top 100 sourcetypes in the last 24 hours"
                "app": "my-app"
			}
		},
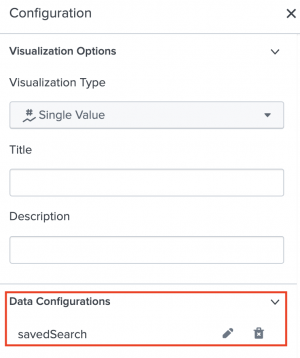
You can look to the URL while viewing the report to determine the correct formatting for the name of the app it is saved in. You can also see details about your searches in the visual editor of the Configuration panel in the Data Configurations section.
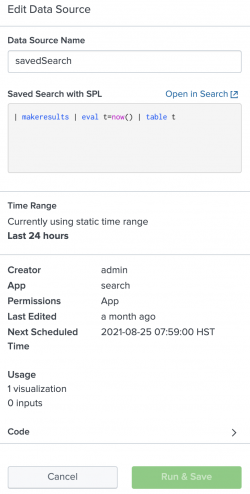
When you click on the report, you will see the following:
- The saved search name in the Data Source Name field.
- The query used in the Saved Search with SPL window.
- The time range set in the stanza.
- The creator of the saved search.
- The location of the original saved search.
- The permission status.
- The last time the saved search was edited.
You can't change any of the information using this panel, however, you can click Open in Reports to open the original search in the app where the saved search exists.
ds.savedSearch options
Unlike ds.search, the ds.savedSearch data source type does not respect the name or query options. The only options that you can use are ref and app, as well as refresh and refreshType for searches that are not scheduled searches. For example, the following saved search refreshes at five second intervals:
"reportNoScheduleWithRefresh": {
		"type": "ds.savedSearch",
		"options": {
			"ref": "Current Time",
		        "refresh": "5s",
			"refreshType": "interval"
		},
Scheduled saved searches
When editing a data source in the source code, if you are referencing a scheduled saved search, your dashboard will respect that schedule regardless of whether you set the refresh or refreshType options. For example, if a report from the Search & Reporting app has been scheduled to run at the top of every minute, setting the refresh interval to five seconds in the JSON stanza will have no effect. The scheduled search will continue to run at the top of every minute. The same is true for any settings that apply to the data source type in the defaults section of the dashboard definition.
If the report is a scheduled search, but its first scheduled run has not yet completed, the search will run automatically the first time it's added to the dashboard definition.
Use a saved search as a base search for scheduled chain searches
You can use the ds.savedSearch data source as a base search in the same way that you can use ds.search as a base search. The ds.chain data source accepts all of the options that it would if the base search was of type ds.search. For example:
		"baseReportNoScheduleWithRefresh": {
			"type": "ds.savedSearch",
			"options": {
				"ref": "Current Time",
				"refresh": "5s",
				"refreshType": "interval"
			}
		},
		"postReportNoScheduleWithRefresh": {
			"type": "ds.chain",
			"options": {
				"query": "| eval count=count-1500000000",
				"extend": "baseReportNoScheduleWithRefresh"
			},
			"name": "Data Source Name: Post Report - No Schedule, With Refresh"
		},
For more information on chain searches, see Chain searches together with a base search and chain searches.
Remember, if you have the cancelJobsOnFocusLoss option, or any other options set in the defaults section of the dashboard definition, it most likely affects the data source of type ds.search. Since ds.savedSearch is a different type, these searches will not be affected by that setting and will continue to run in the background. It is important that you do not set cancelJobsOnFocusLoss for the ds.savedSearch data type since these searches are usually scheduled and depend on being run uninterrupted.
| Chain searches together with a base search and chain searches | Use mock data with ds.test |
This documentation applies to the following versions of Splunk Cloud Platform™: 8.2.2112


 Download manual
Feedback submitted, thanks!