Setting tokens on a visualization click
Use predefined tokens to capture information when a user clicks different visualization elements. Dashboard Studio supports three predefined tokens:
- name
- value
- row.<fieldname>.value
The following table represents the predefined token availability and how captured values vary according to visualization type.
| Visualization | name | value | row.<fieldname>.value |
|---|---|---|---|
| splunk.area | Y-axis field name of the series/location clicked | Y-axis value of the series/location clicked | Value in the specified series corresponding to the location clicked |
| splunk.bar | Y-axis field name of the series/location clicked | Y-axis value of the series/location clicked | Value in the specified series corresponding to the location clicked |
| splunk.bubble | Y-axis field name of the series/location clicked | Y-axis value of the series/location clicked | Value in the specified series corresponding to the location clicked |
| splunk.column | Y-axis field name of the series/location clicked | Y-axis value of the series/location clicked | Value in the specified series corresponding to the location clicked |
| splunk.line | Y-axis field name of the series/location clicked | Y-axis value of the series/location clicked | Value in the specified series corresponding to the location clicked |
| splunk.scatter | Y-axis field name of the series/location clicked | Y-axis value of the series/location clicked | Value in the specified series corresponding to the location clicked |
| splunk.choropleth.svg | Name of the area clicked | Value of the area clicked | n/a |
| splunk.pie | Field name of the value clicked | Value of the location clicked | Value in the specified series corresponding to the location clicked |
| splunk.singlevalue | Field name of the majorValue | Value of the majorValue | n/a |
| splunk.singlevalueicon | Field name of the majorValue | Value of the majorValue | n/a |
| splunk.table | Field name of the cell clicked | Value of the cell clicked | Value in the specified series in the same row as the cell clicked |
Setting tokens
- Navigate to the Drilldown Settings section of the Configuration panel.
- Click +Add Drilldown
- In the On Click dropdown, select Set Tokens
- Click +Set Another Token
- In the Set Token dropdown select either Use predefined token or Enter static value.
- A predefined token captures information to display dynamically
- A static value is a string
- In the Create a name field, type a name for your token. Token names are used to reference the token elsewhere in the dashboard with the
$token_name$syntax - In the Choose an event field, select either name, value, or row.<fieldname>.value
- name is the field name of the value/location clicked
- value is the value of the location clicked
- row.<fieldname>.value is the value in the specified series corresponding to the location clicked
- Click Apply
- Add your token to a search or visualization within your dashboard.
Example of setting a token
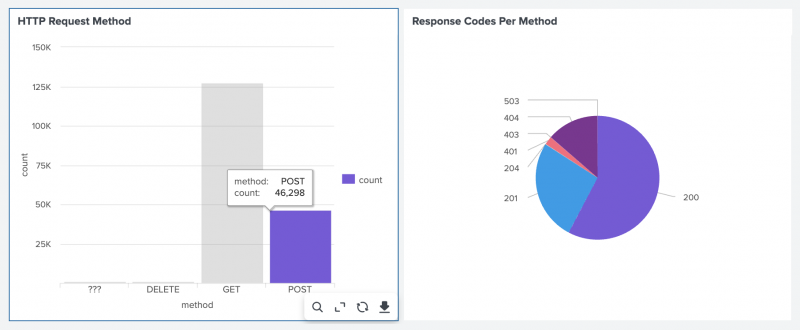
You can specify a token that passes along information between different visualizations. The following example shows two charts. One is a column chart that displays HTTP methods and their usage frequency, and the other is a pie chart that shows the analysis of HTTP response codes for a given HTTP method. When users click on a method in the column chart, the pie chart shows a breakdown of all response codes for the clicked method. The data connection between the two visualizations is achieved by setting up a token on the column chart $method$=row.method.value and passing the $method$ token to the search in the pie chart.
Source code
The following is a source code example of setting a token. Notice how the token is given the name "method" in the column chart's "options" and how that name is used in the token name syntax as $method$ in "Search_2".
[...]
	"visualizations": {
		"viz_Cm0UW3Gc": {
			"type": "splunk.column",
			"options": {},
			"dataSources": {
				"primary": "ds_qBGlESX2"
			},
			"eventHandlers": [
				{
					"type": "drilldown.setToken",
					"options": {
						"tokens": [
							{
								"token": "method",
								"key": "row.method.value"
							}
						]
					}
				}
			],
			"context": {},
			"showProgressBar": false,
			"showLastUpdated": false
		},
		"viz_KabMOTyq": {
			"type": "splunk.pie",
			"options": {},
			"dataSources": {
				"primary": "ds_c8AfQapt"
			}
		}
	},
	"dataSources": {
		"ds_qBGlESX2": {
			"type": "ds.search",
			"options": {
				"query": "index=_internal \n| stats count by method"
			},
			"name": "Search_1"
		},
		"ds_c8AfQapt": {
			"type": "ds.search",
			"options": {
				"query": "index=_internal method=$method$\n| stats count by status"
			},
			"name": "Search_2"
		}
	},
[...]
| Use inputs and tokens to make dashboards dynamic | Object options and defaults reference |
This documentation applies to the following versions of Splunk Cloud Platform™: 8.2.2112

 Download manual
Feedback submitted, thanks!