Splunk Web terminology
The Splunk platform GUI is called "Splunk Web". The UI elements in Splunk Web have specific names.
When logging in to Splunk Web, you typically begin at the Search Summary page. After running a search, you view the search results on the New Search page. You can also go to other pages in the app, which usually contain lists of datasets, reports, alerts, and so on. These pages vary depending on the app. For the Search & Reporting app, you can navigate to the Datasets, Reports, Alerts, and Dashboards pages or return to the Search page.
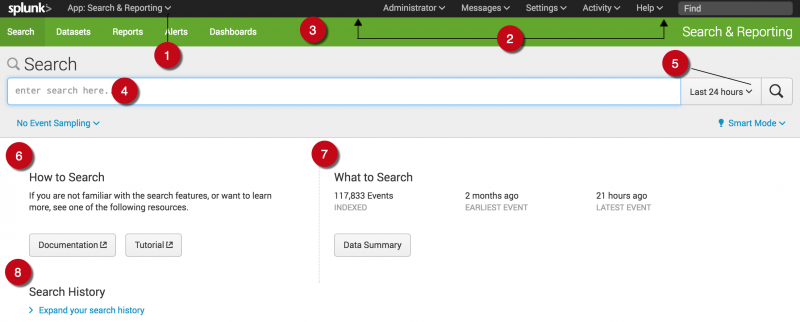
The Search Summary page
The Search Summary page includes common elements that you see on other pages, including the Applications menu, the Splunk bar, the Apps bar, the Search bar, and the Time Range Picker. Elements that are unique to this page are the panels located after the Search bar: the How to Search panel, the What to Search panel, and the Search History panel.
| Number | Element | Description |
|---|---|---|
| 1 | Applications menu | Switch between installed Splunk apps. The Search & Reporting app is listed as the current app. This menu is on the Splunk bar. |
| 2 | Splunk bar | Edit your configuration, view system-level messages, and get help on using the product. |
| 3 | Apps bar | Navigate between the different pages in the application you are in. For the Search & Reporting app, you can select each tab in the Apps bar to navigate to the Search, Datasets, Reports, Alerts, and Dashboards pages. |
| 4 | Search bar | Specify your search criteria. |
| 5 | Time Range Picker | Specify the time period for the search, such as the last 30 minutes or yesterday. The default is Last 24 hours. |
| 6 | How to search panel | Contains links to the Search Tutorial and Search Manual. |
| 7 | What to search panel | Shows a summary of the data that is uploaded on to this Splunk platform instance and that you are authorized to view. |
| 8 | Search history panel | View a list of the searches that you have run. The search history appears after you run your first search. |
The New Search page
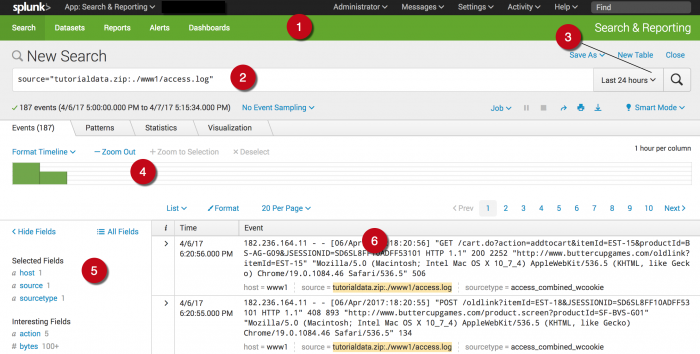
The New Search page opens after you run a search.
Some of the elements on this page might be familiar, such as the Apps bar, the Search bar, and the Time Range Picker. The area following the Search bar contains the Timeline, the Fields sidebar, and the Events viewer.
| Number | Element | Description |
|---|---|---|
| 1 | Apps bar | Navigate between the different pages in the Search & Reporting app. Each page is linked to using a tab on the Apps bar. |
| 2 | Search bar | Specify your search criteria. |
| 3 | Time Range Picker | Specify the time period for the search. |
| 4 | Timeline | A visual representation of the number of events that occur at each point in time. Peaks or valleys in the timeline can indicate spikes in activity or server downtime. The timeline options are located above the timeline. You can zoom in, zoom out, and change the scale of the chart. |
| 5 | Fields sidebar | Displays a list of the fields discovered in the events. The fields are grouped into Selected Fields and Interesting Fields. |
| 6 | Event viewer | Displays the events that match your search. By default, the most recent event is listed first. In each event, the matching search terms are highlighted. To change the event viewer, use the List, Format, and Per Page options. |
| Splunk product terminology | Trademark attribution |
This documentation applies to the following versions of Splunk® Style Guide: current


 Download manual
Feedback submitted, thanks!