Scenario: Deepu monitors service performance using a built-in dashboard 🔗
Buttercup Games launches a Black Friday sales event. Deepu, the payment service owner, expects higher traffic on the website that might impact the payment service. In addition to setting Splunk APM detectors to alert for the atypical error rate and latency, Deepu uses the Splunk APM Service dashboard for monitoring.
These are the steps Deepu takes to monitor the payment service using a Splunk APM Service dashboard:
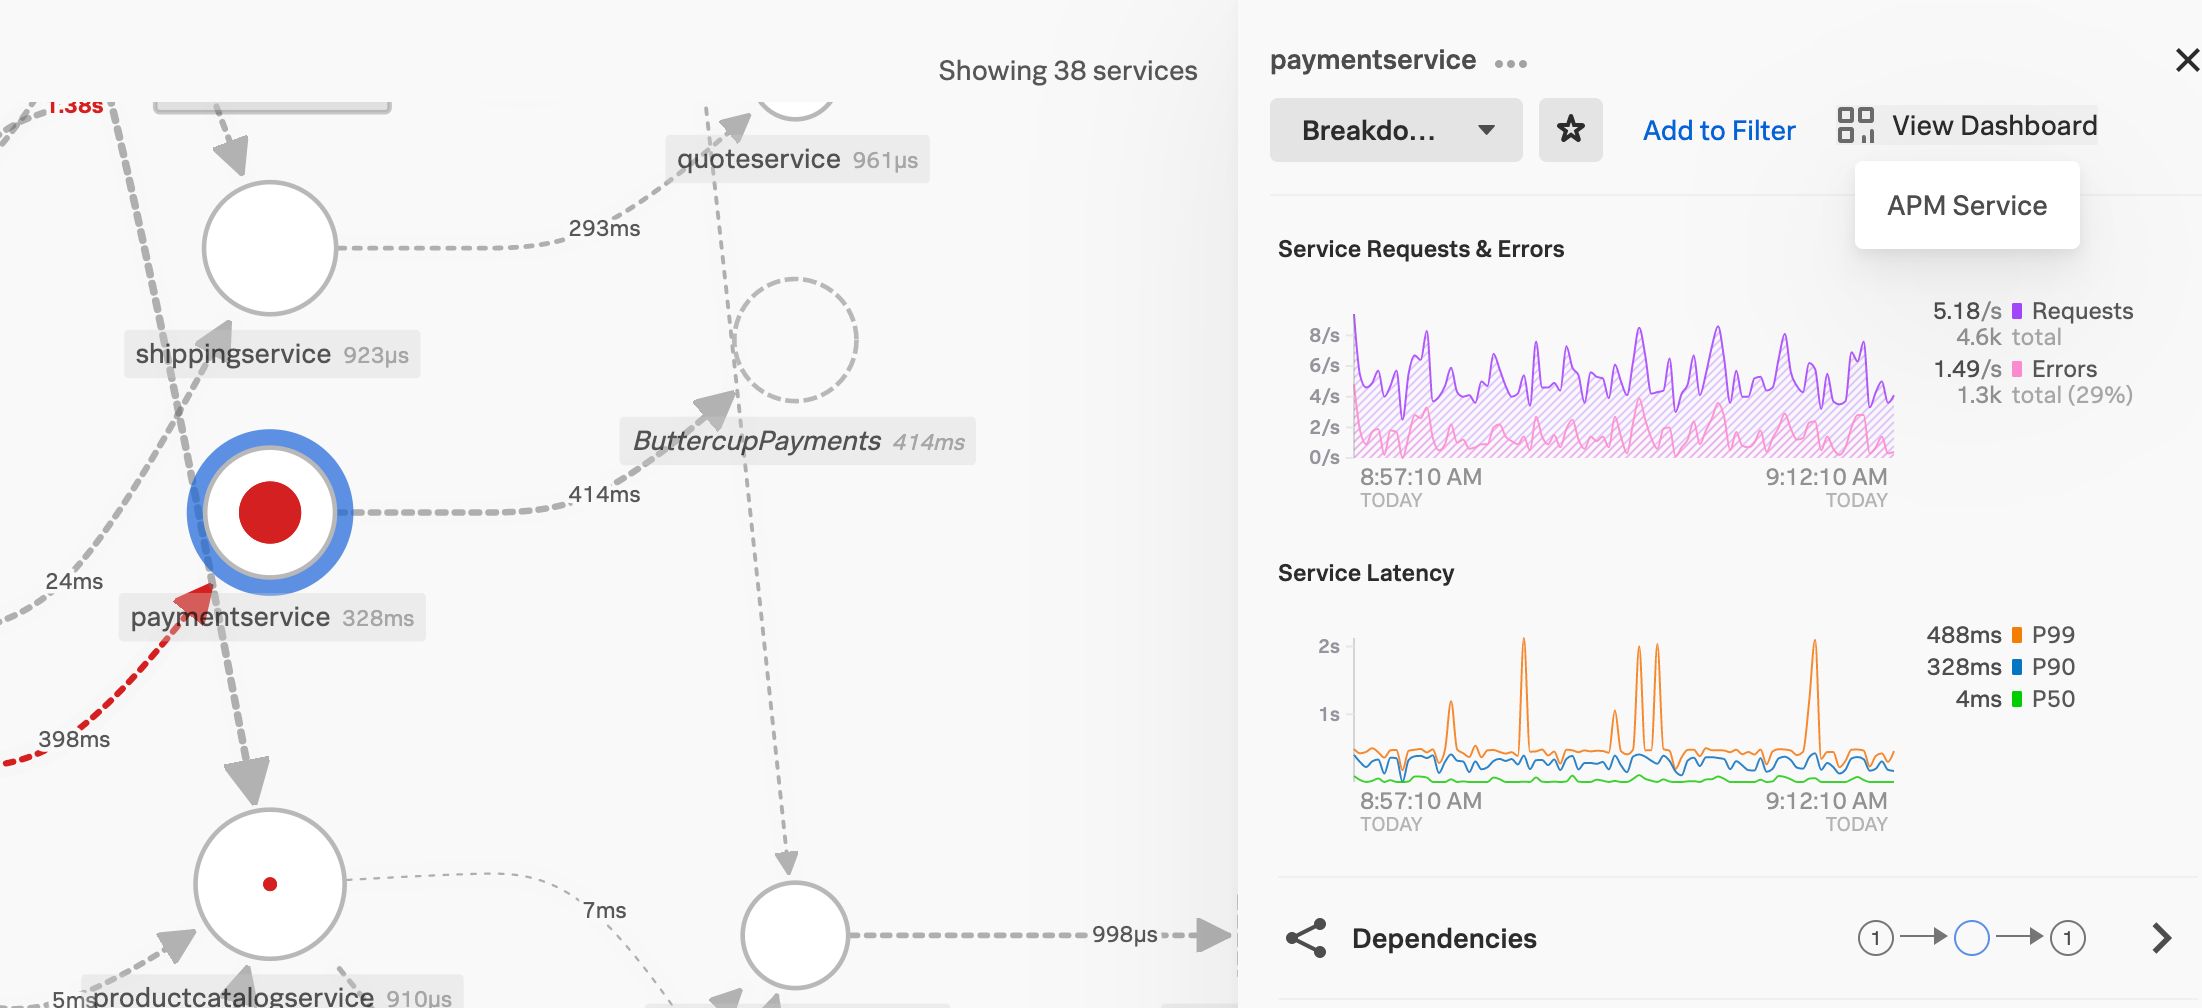
Deepu opens the APM Service dashboard for the payment service 🔗
From the APM Overview, Deepu selects Service Map to access the service map. Deepu selects the paymentservice node and selects View Dashboard on the sidebar.
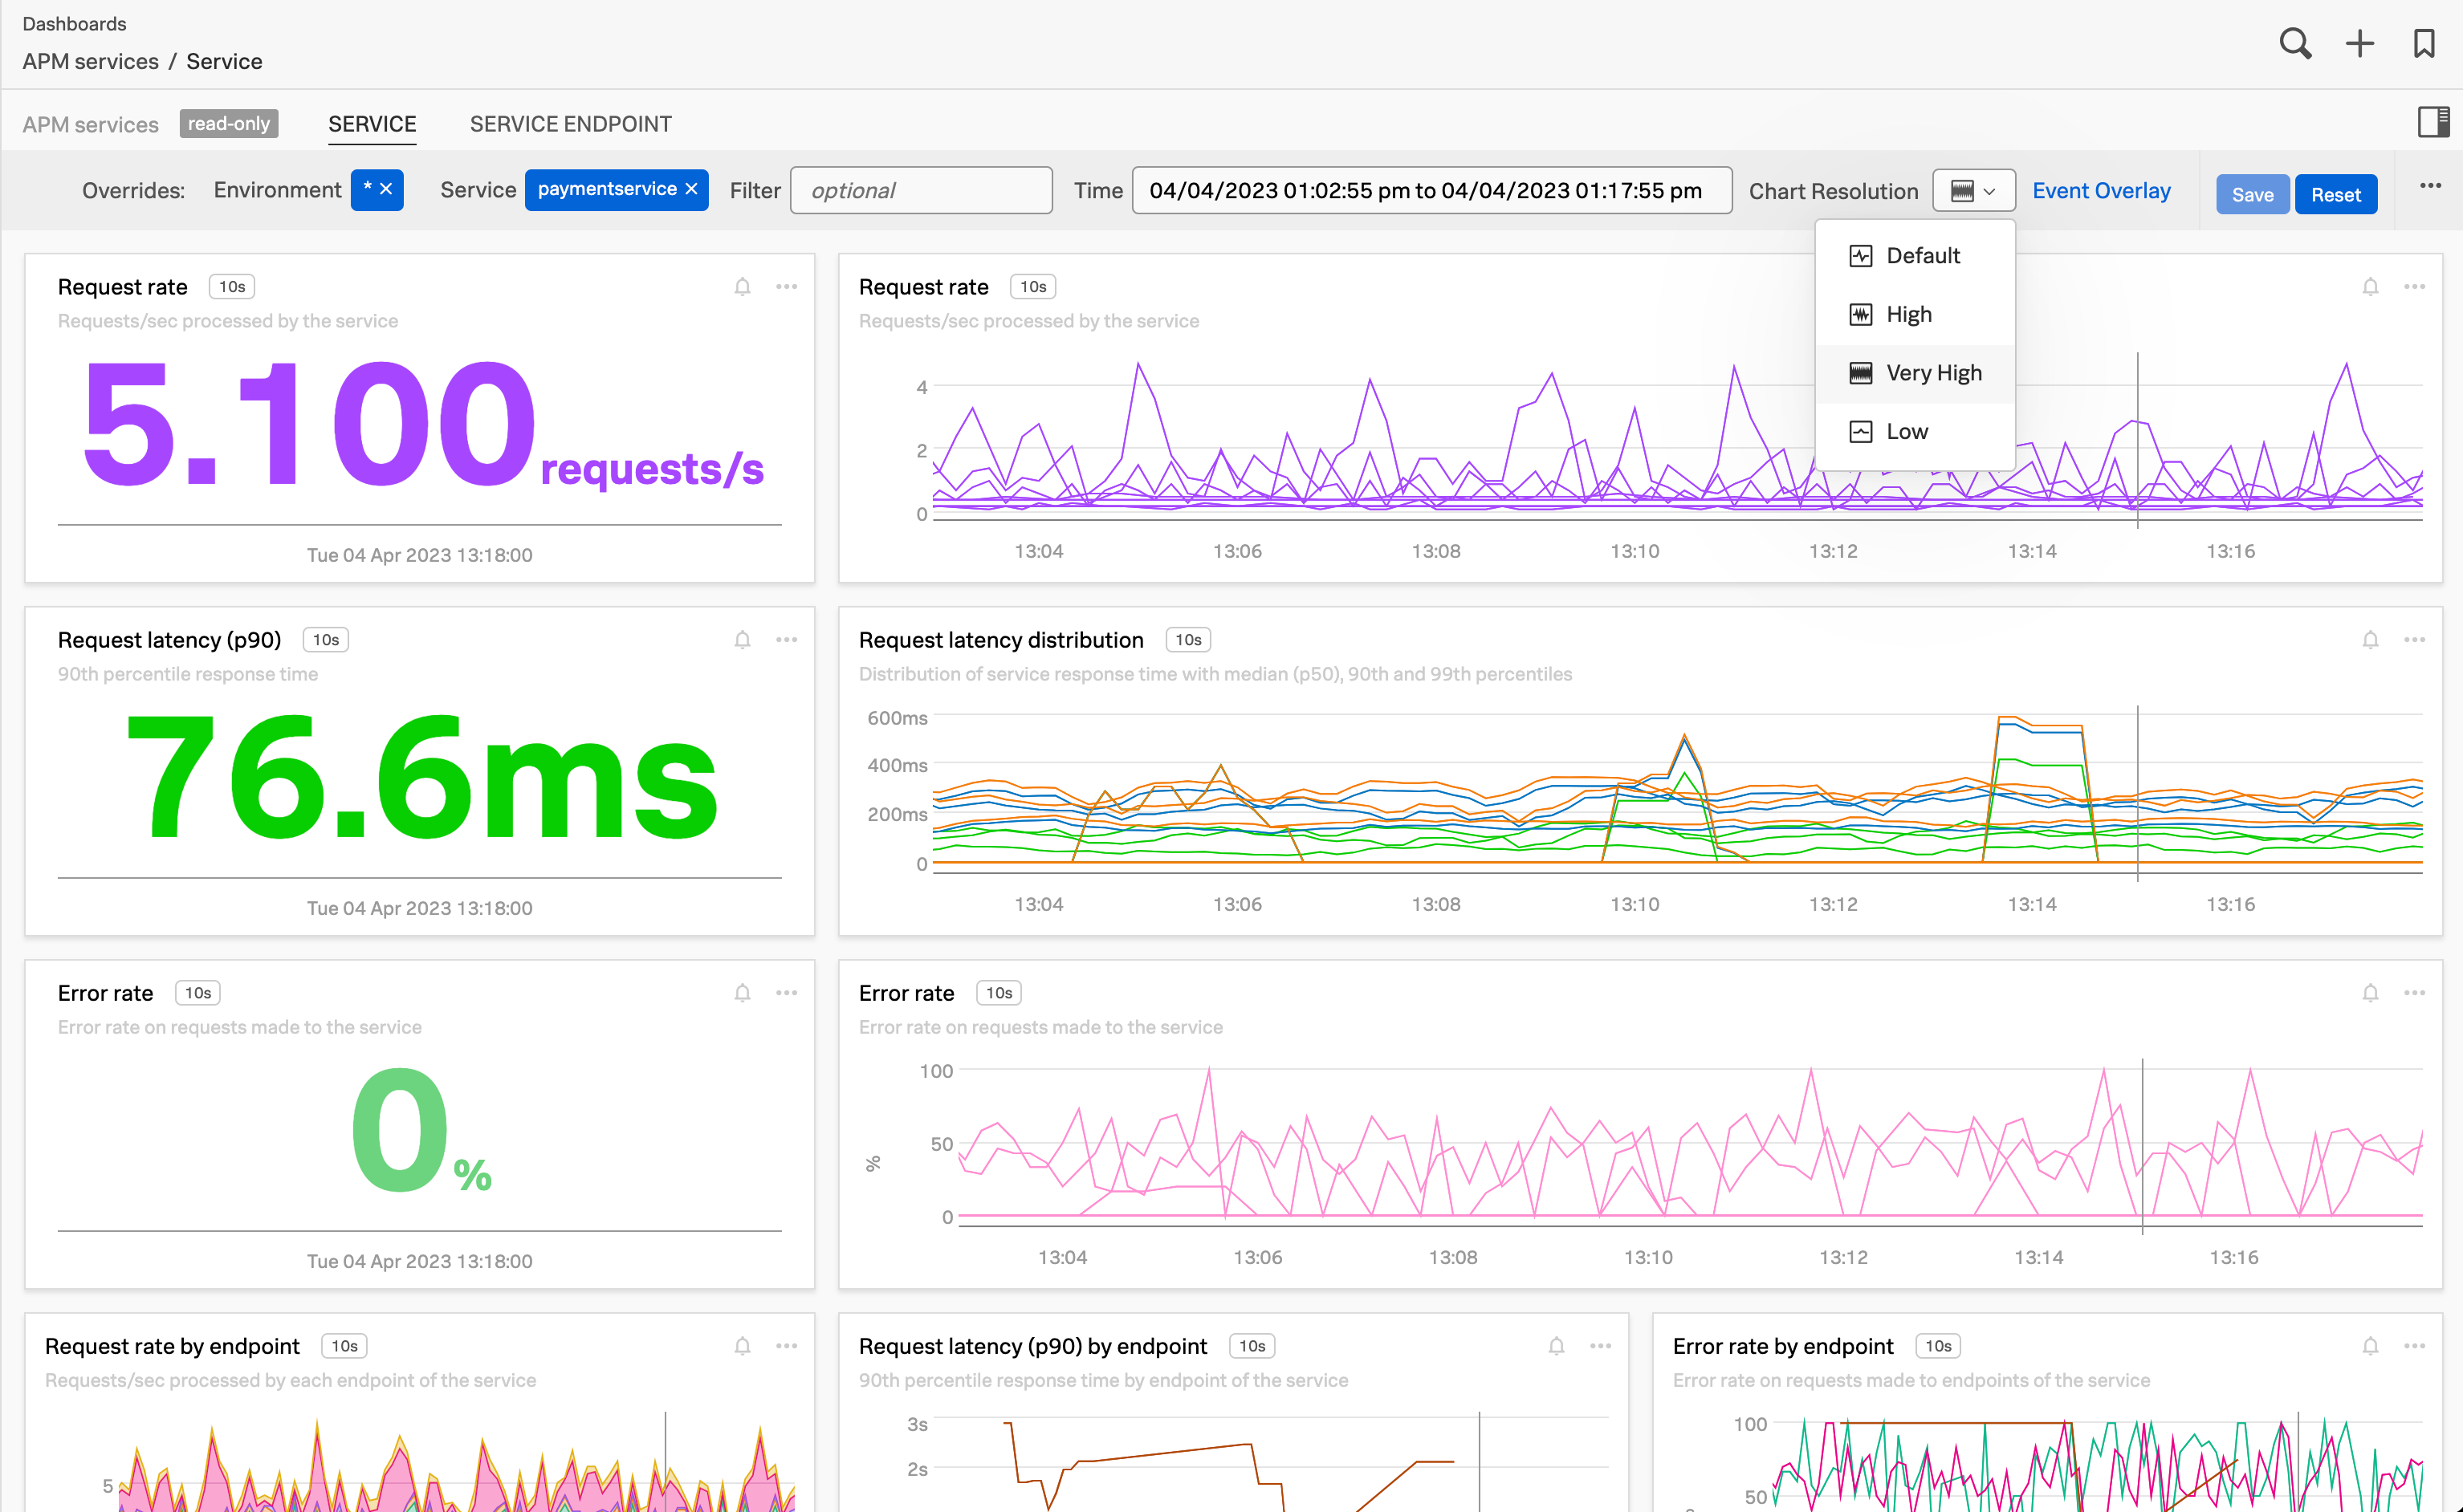
Deepu adjusts the dashboard chart resolution and uses a data link to go to a related infrastructure dashboard 🔗
Deepu sees the built-in dashboard for the payment service and then sets the Chart Resolution to very high for monitoring more details. Deepu configured global data links to connect Splunk APM properties to related resources in Splunk Observability Cloud. By selecting a tag with a global data link, Deepu can navigate to an infrastructure-related dashboard that they can use to cross-monitor the payment service and the infrastructure.
Learn more 🔗
For details about how to configure Splunk APM detectors, see Configure detectors and alerts in Splunk APM.
To learn more about creating global data links, see Use data links to connect APM properties to relevant resources.
For more information about using Splunk Infrastructure Monitoring, see Introduction to Splunk Infrastructure Monitoring.