Instrument .NET Azure functions for Splunk Observability Cloud 🔗
By instrumenting .NET Azure functions you can send spans to Splunk Observability Cloud every time your functions run. You can instrument both isolated worker process and in-process functions.
To instrument your .NET Azure function with OpenTelemetry to send telemetry to Splunk Observability Cloud, follow these high-level steps:
Note
The SignalFx C# Azure Function wrapper is deprecated. Use the following method instrument your Azure functions.
Define the environment variables 🔗
Set the required environment variables in your function’s settings:
Select your function in Function App.
Go to Settings, then Configuration.
Select New application setting to add the following settings:
Name
Value
SPLUNK_ACCESS_TOKENYour Splunk access token. To obtain an access token, see Retrieve and manage user API access tokens using Splunk Observability Cloud.
SPLUNK_REALMYour Splunk Observability Cloud realm, for example
us0. To find your Splunk realm, see Note about realms.Add any other settings you might need.
Add the required libraries using NuGet 🔗
Add the following libraries using NuGet in Visual Studio:
Activate the Include prerelease setting.
Install the latest version of the following libraries:
Activate the Include prerelease setting.
Install the specified version of the following libraries:
Note
Due to runtime dependencies, only the indicated versions are guaranteed to work when instrumenting in-process functions.
Initialize OpenTelemetry in the code 🔗
After adding the dependencies, initialize OpenTelemetry in your function.
Add startup initialization in the Program.cs file:
using Microsoft.Extensions.DependencyInjection;
using Microsoft.Extensions.Hosting;
using OpenTelemetry;
using OpenTelemetry.Exporter;
using OpenTelemetry.ResourceDetectors.Azure;
using OpenTelemetry.Resources;
using OpenTelemetry.Trace;
using System.Diagnostics;

// Get environment variables from function configuration
// You need a valid Splunk Observability Cloud access token and realm
var serviceName = Environment.GetEnvironmentVariable("WEBSITE_SITE_NAME") ?? "Unknown";
var accessToken = Environment.GetEnvironmentVariable("SPLUNK_ACCESS_TOKEN")?.Trim();
var realm = Environment.GetEnvironmentVariable("SPLUNK_REALM")?.Trim();

ArgumentNullException.ThrowIfNull(accessToken, "SPLUNK_ACCESS_TOKEN");
ArgumentNullException.ThrowIfNull(realm, "SPLUNK_REALM");

var tp = Sdk.CreateTracerProviderBuilder()
   // Use Add[instrumentation-name]Instrumentation to instrument missing services
   // Use Nuget to find different instrumentation libraries
   .AddHttpClientInstrumentation(opts =>
   {
      // This filter prevents background (parent-less) http client activity
      opts.FilterHttpWebRequest = req => Activity.Current?.Parent != null;
      opts.FilterHttpRequestMessage = req => Activity.Current?.Parent != null;
   })
   // Use AddSource to add your custom DiagnosticSource source names
   //.AddSource("My.Source.Name")
   // Creates root spans for function executions
   .AddSource("Microsoft.Azure.Functions.Worker")
   .SetSampler(new AlwaysOnSampler())
   .ConfigureResource(configure => configure
      .AddService(serviceName: serviceName, serviceVersion: "1.0.0")
      // See https://github.com/open-telemetry/opentelemetry-dotnet-contrib/tree/main/src/OpenTelemetry.ResourceDetectors.Azure
      // for other types of Azure detectors
      .AddDetector(new AppServiceResourceDetector()))
   .AddOtlpExporter(opts =>
   {
      opts.Endpoint = new Uri($"https://ingest.{realm}.signalfx.com/v2/trace/otlp");
      opts.Protocol = OtlpExportProtocol.HttpProtobuf;
      opts.Headers = $"X-SF-TOKEN={accessToken}";
   })
   .Build();

var host = new HostBuilder()
   .ConfigureFunctionsWorkerDefaults()
   .ConfigureServices(services => services.AddSingleton(tp))
   .Build();

host.Run();
Note
When instrumenting isolated worker process functions, you can encapsulate startup initialization and parameters into other functions.
Define a startup function and decorate the assembly with it. The startup function uses the Azure.Functions.Extensions package to collect useful metadata.
using Microsoft.Azure.Functions.Extensions.DependencyInjection;
using Microsoft.Extensions.DependencyInjection;
using OpenTelemetry;
using OpenTelemetry.Exporter;
using OpenTelemetry.Resources;
using OpenTelemetry.Trace;
using System;
using System.Collections.Generic;

// Decorate assembly with startup function
[assembly: FunctionsStartup(typeof(OtelManualExample.Startup))]

namespace OtelManualExample
{
   public class Startup : FunctionsStartup
   {
      public override void Configure(IFunctionsHostBuilder builder)
      {
         // Get environment variables from function configuration
         // You need a valid Splunk Observability Cloud access token and realm
         var serviceName = Environment.GetEnvironmentVariable("WEBSITE_SITE_NAME") ?? "Unknown";
         var accessToken = Environment.GetEnvironmentVariable("SPLUNK_ACCESS_TOKEN")?.Trim();
         var realm = Environment.GetEnvironmentVariable("SPLUNK_REALM")?.Trim();

         ArgumentNullException.ThrowIfNull(accessToken, "SPLUNK_ACCESS_TOKEN");
         ArgumentNullException.ThrowIfNull(realm, "SPLUNK_REALM");

         var tp = Sdk.CreateTracerProviderBuilder()
            // Use Add[instrumentation-name]Instrumentation to instrument missing services
            // Use Nuget to find different instrumentation libraries
            .AddHttpClientInstrumentation(opts =>
            {
                // This filter prevents background (parent-less) http client activity
                opts.FilterHttpRequestMessage = req => Activity.Current?.Parent != null;
                opts.FilterHttpWebRequest = req => Activity.Current?.Parent != null;
            })
            .AddAspNetCoreInstrumentation()
            // Use AddSource to add your custom DiagnosticSource source names
            //.AddSource("My.Source.Name")
            .SetSampler(new AlwaysOnSampler())
            // Add resource attributes to all spans
            .SetResourceBuilder(
               ResourceBuilder.CreateDefault()
               .AddService(serviceName: serviceName, serviceVersion: "1.0.0")
               .AddAzureAppServiceDetector()
               .AddAttributes(new Dictionary<string, object>() {
                  { "faas.instance", Environment.GetEnvironmentVariable("WEBSITE_INSTANCE_ID") }
               }))
            .AddOtlpExporter(opts =>
            {
               opts.Endpoint = new Uri($"https://ingest.{realm}.signalfx.com/v2/trace/otlp");
               opts.Protocol = OtlpExportProtocol.HttpProtobuf;
               opts.Headers = $"X-SF-TOKEN={accessToken}";
            })
            .Build();

         builder.Services.AddSingleton(tp);
      }
   }
}
Instrument the code to send spans 🔗
Next, instrument your code using OpenTelemetry. Use the following examples as a starting point to instrument your code. See https://learn.microsoft.com/en-us/azure/azure-functions/functions-how-to-use-azure-function-app-settings in Microsoft Azure documentation for steps to add environment variables to an Azure function.
The following example shows how to instrument a function using start and stop helper functions:
using System.Diagnostics;
using System.Net;
using Microsoft.Azure.Functions.Worker;
using Microsoft.Azure.Functions.Worker.Http;
using Microsoft.Extensions.Logging;

namespace OtelManualIsolatedExample
{
   public class ExampleFunction
   {
      private readonly ILogger _logger;

      public ExampleFunction(ILoggerFactory loggerFactory)
      {
            _logger = loggerFactory.CreateLogger<ExampleFunction>();
      }
// Define helper functions for manual instrumentation
      public static ActivitySource ManualInstrumentationSource = new ActivitySource("manualInstrumentation");
      public static Activity? StartActivity(HttpRequestData req, FunctionContext fc)
      {
// Retrieve resource attributes
            var answer = ManualInstrumentationSource.StartActivity(req.Method.ToUpper() + " " + req.Url.AbsolutePath, ActivityKind.Server);
            answer?.AddTag("http.url", req.Url);
            answer?.AddTag("faas.invocation_id", fc.InvocationId.ToString());
            answer?.AddTag("faas.name", Environment.GetEnvironmentVariable("WEBSITE_SITE_NAME") + "/" + fc.FunctionDefinition.Name);
            return answer;
      }
      public static HttpResponseData FinishActivity(HttpResponseData response, Activity? activity)
      {
            activity?.AddTag("http.status_code", ((int)response.StatusCode));
            return response;
      }

      [Function("ExampleFunction")]
// Add the FunctionContext parameter to capture per-invocation information
      public HttpResponseData Run([HttpTrigger(AuthorizationLevel.Anonymous, "get", "post")] HttpRequestData req, FunctionContext fc)
      {
            using (var activity = StartActivity(req, fc))
            {
               var response = req.CreateResponse(HttpStatusCode.OK);
               response.Headers.Add("Content-Type", "text/plain; charset=utf-8");

               response.WriteString("The current time is " + DateTime.Now.ToLongTimeString());

               return FinishActivity(response, activity);
            }
      }
   }
}
The following example shows how to retrieve faas attributes:
public static class ExampleFunction
{
   [FunctionName("ExampleFunction")]
// Add the ExecutionContext parameter to capture per-invocation information
   public static async Task<IActionResult> Run(
         [HttpTrigger(AuthorizationLevel.Anonymous, "get", "post", Route = null)] HttpRequest req,
         ILogger log, ExecutionContext context)
   {
// You can also factor this out into a helper method to use across all functions
         Activity.Current.AddTag("faas.invocation_id", context.InvocationId.ToString());
         Activity.Current.AddTag("faas.name", Environment.GetEnvironmentVariable("WEBSITE_SITE_NAME") + "/" + context.FunctionName);

         string responseMessage = "The current time is " + DateTime.Now.ToLongTimeString();
         return new OkObjectResult(responseMessage);
   }
}
Check that data is coming in 🔗
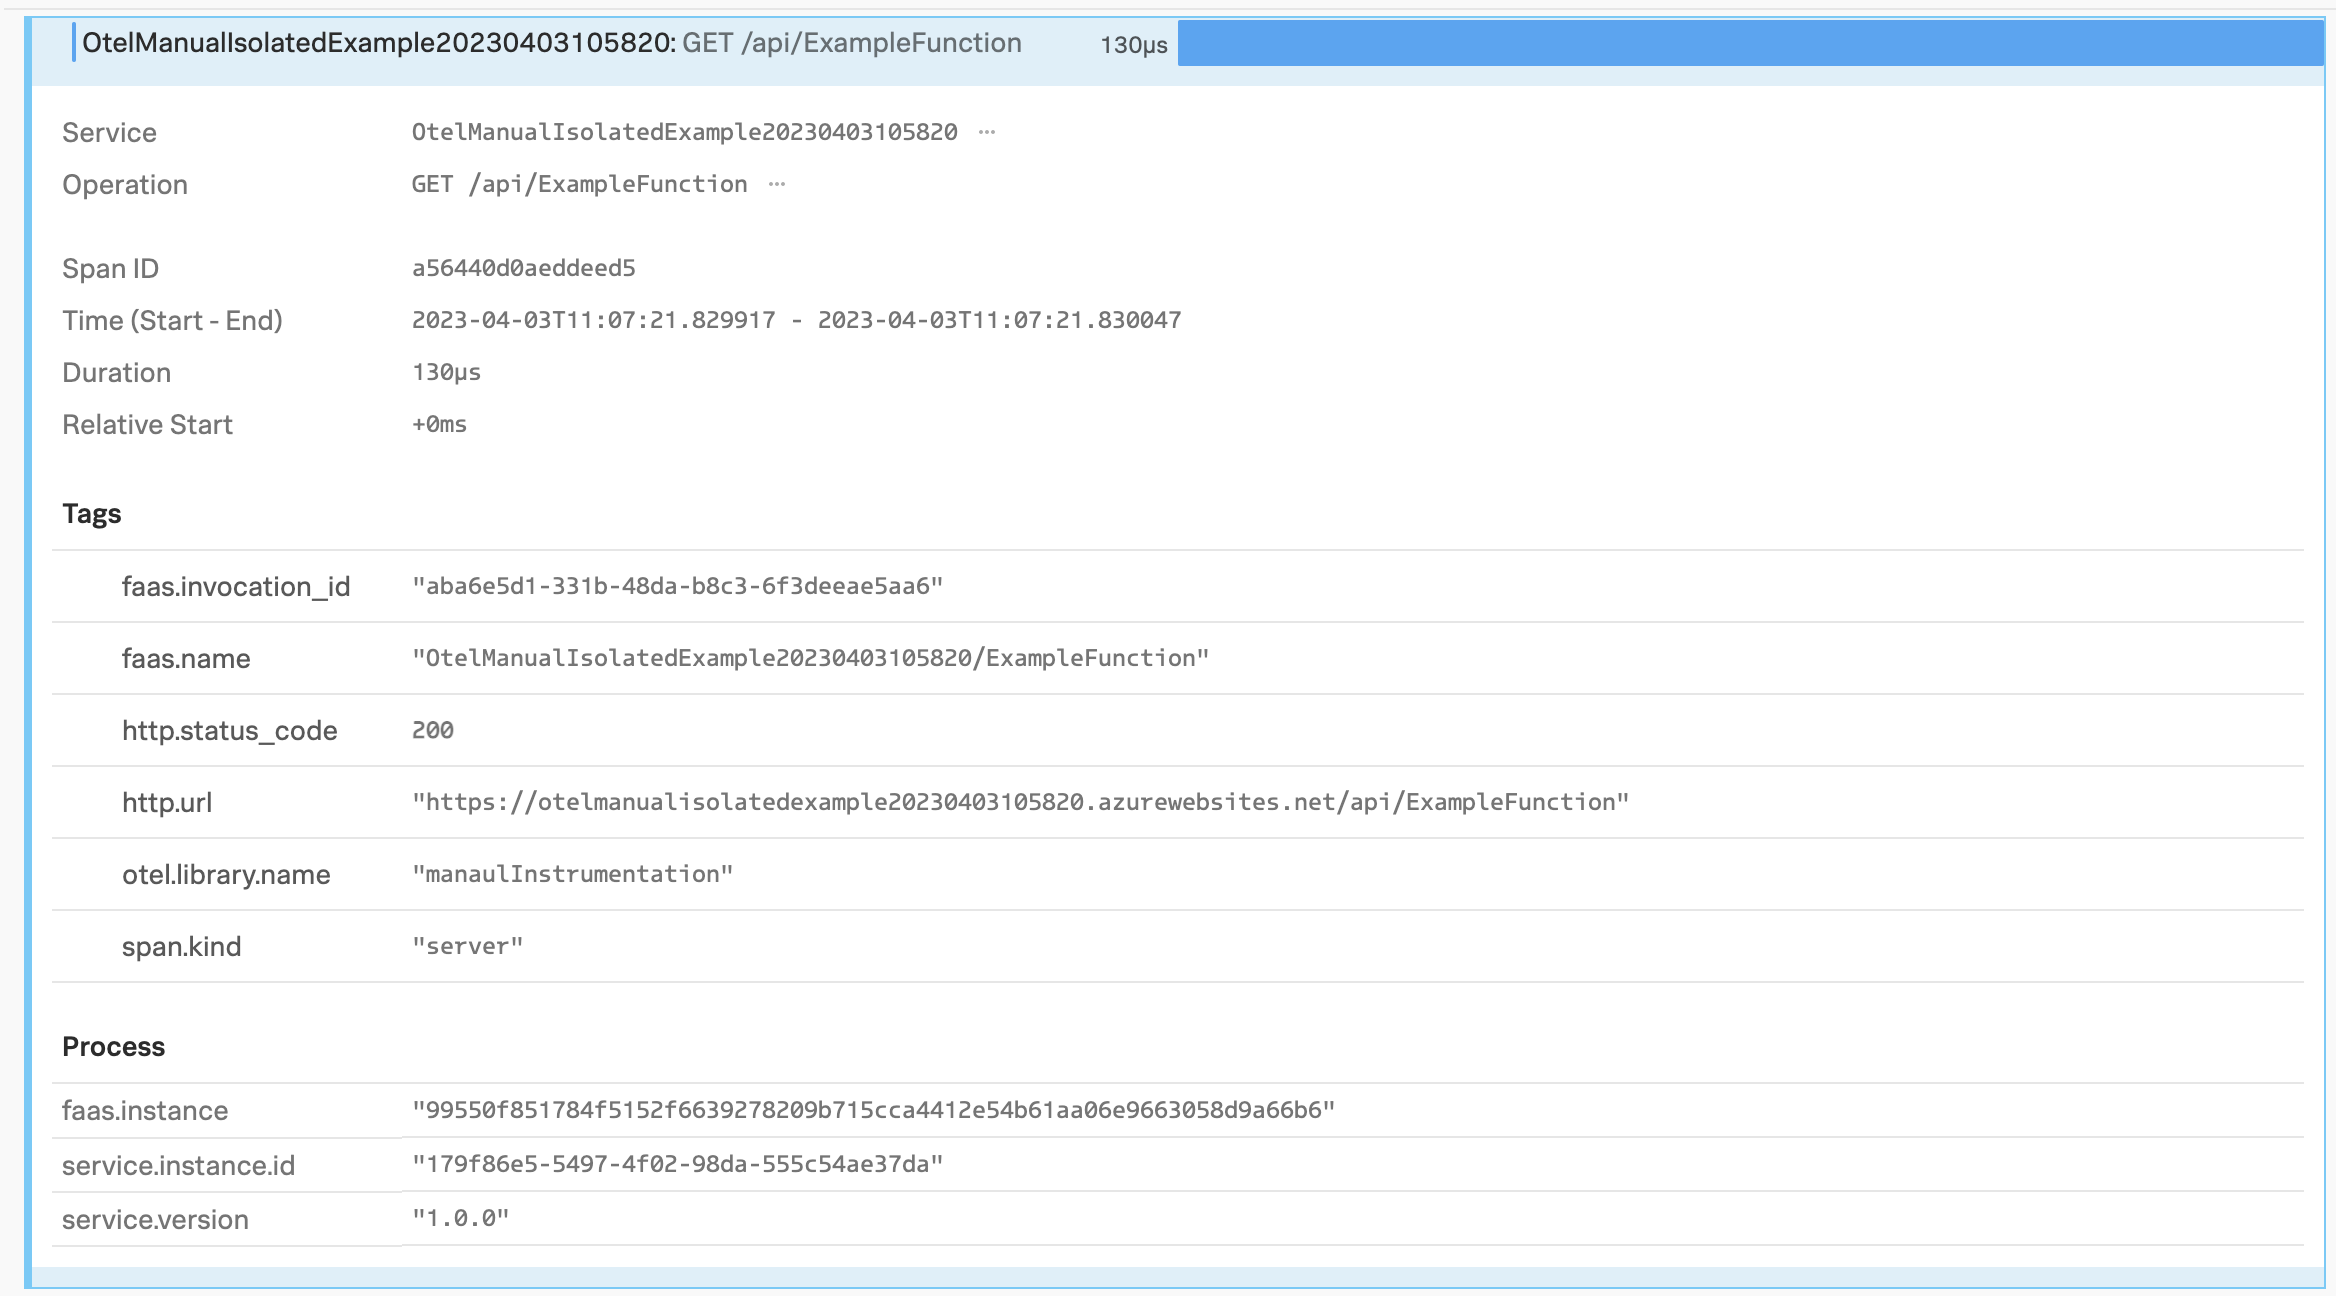
Run your function and search for its spans in Splunk APM. See View and filter for spans within a trace for more information.
The following image shows a span sent by an isolated worker process function. Notice the faas tags:
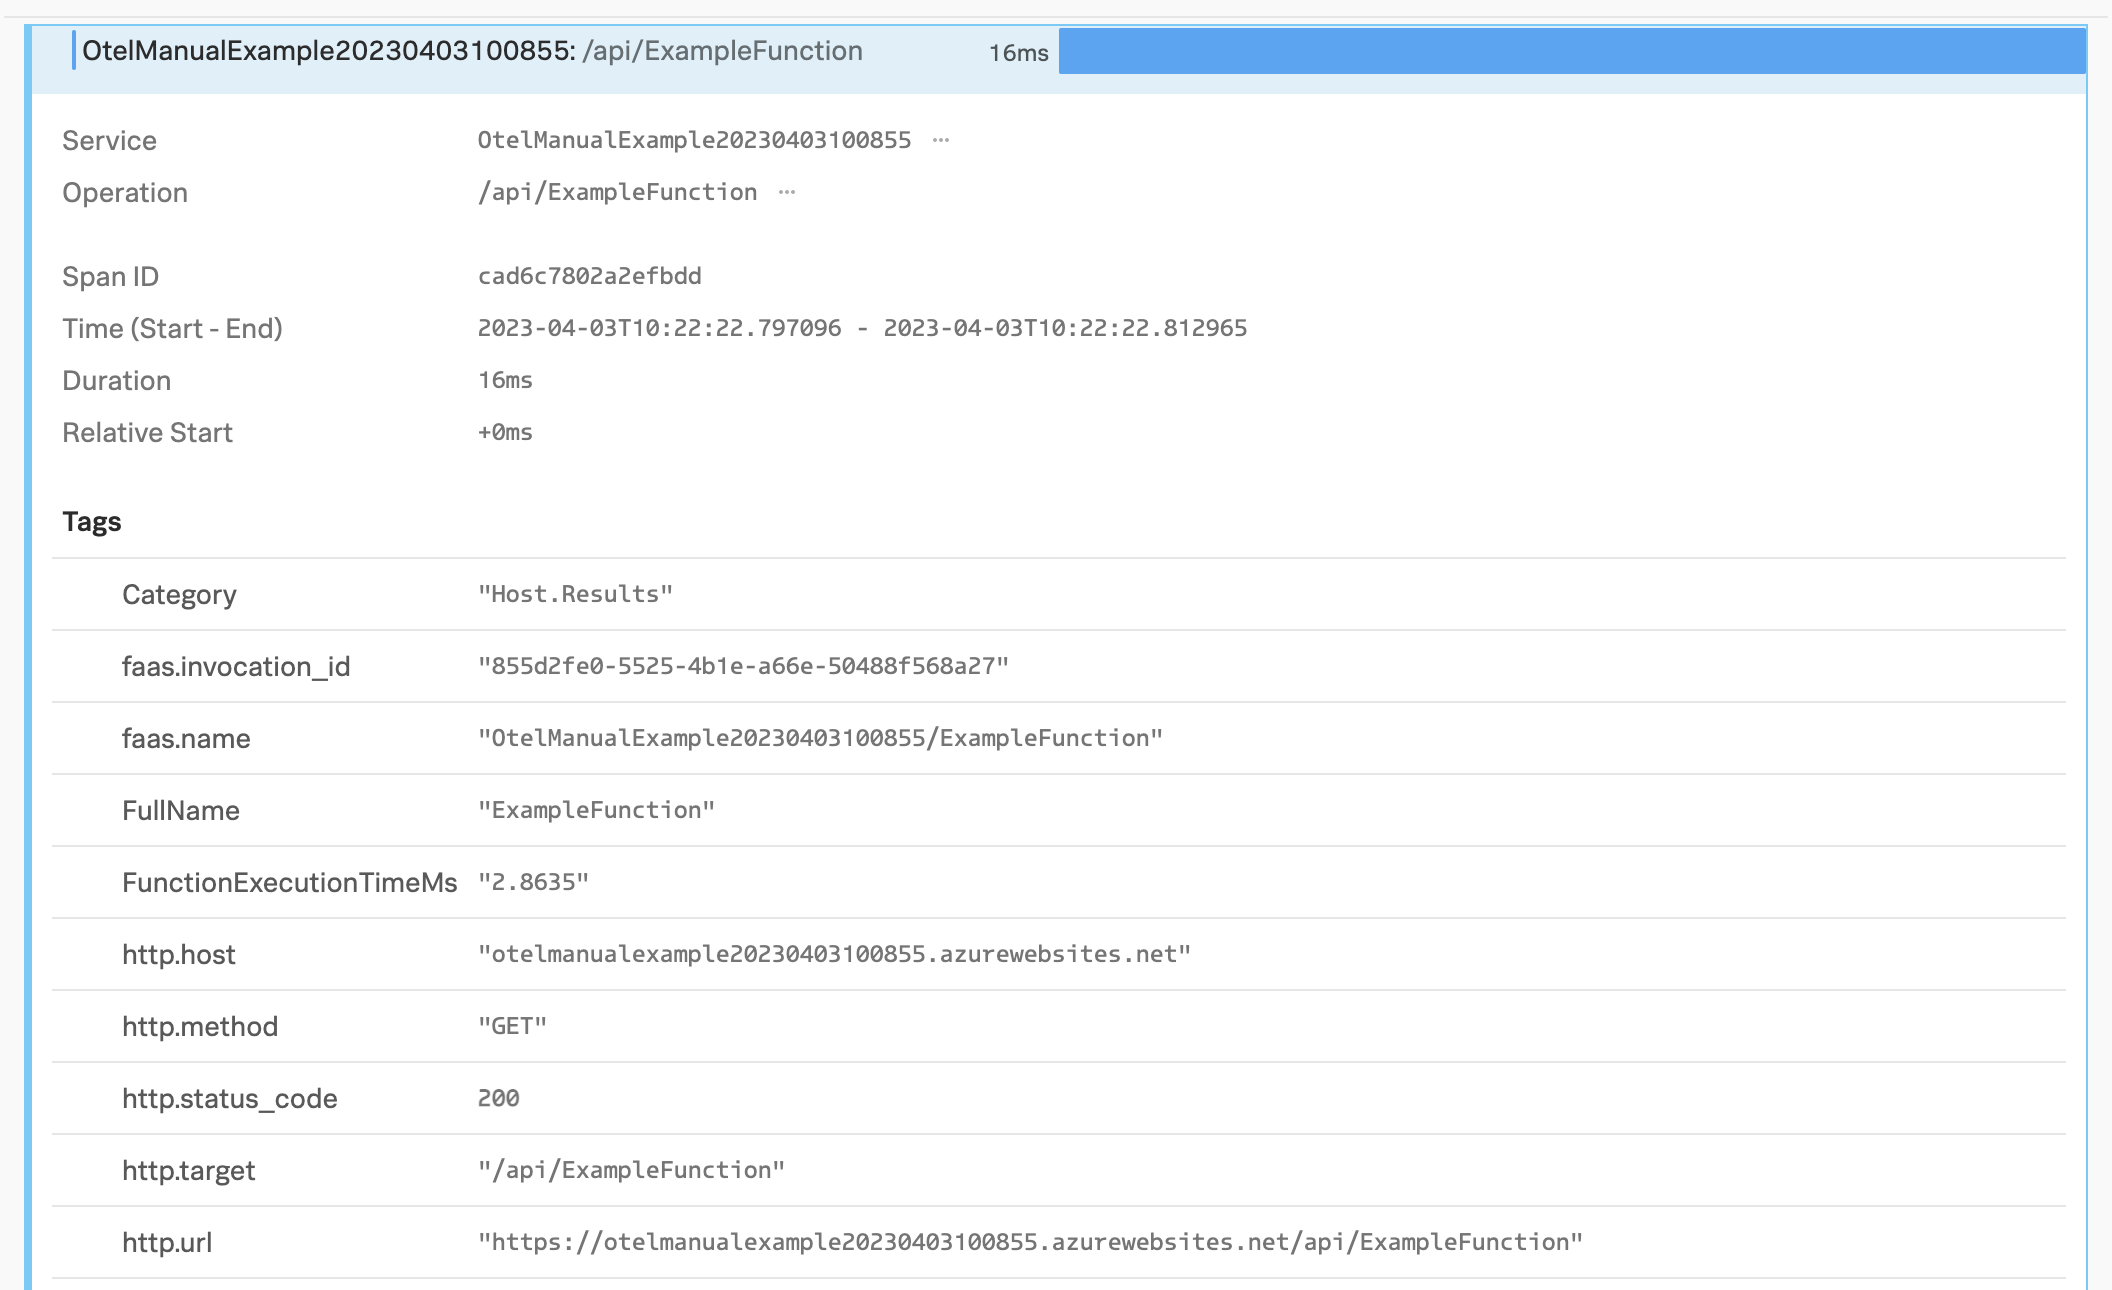
The following image shows a span sent by an in-process function. Notice the faas tags:
Troubleshooting 🔗
If you are a Splunk Observability Cloud customer and are not able to see your data in Splunk Observability Cloud, you can get help in the following ways.
Available to Splunk Observability Cloud customers
Submit a case in the Splunk Support Portal .
Contact Splunk Support .
Available to prospective customers and free trial users
Ask a question and get answers through community support at Splunk Answers .
Join the Splunk #observability user group Slack channel to communicate with customers, partners, and Splunk employees worldwide. To join, see Chat groups in the Get Started with Splunk Community manual.