Windows Performance Counters receiver 🔗
The Windows Performance Counters receiver allows the Splunk Distribution of the OpenTelemetry Collector to collect configured system, application, or custom performance counter data from the Windows Registry. The supported pipeline type is metrics. See Process your data with pipelines for more information.
Note
The Windows Performance Counters receiver only works on Windows hosts.
The Windows Performance Counters receiver replaces the Smart Agent monitor Windows Performance Counters (deprecated). It’s based on the Telegraf Windows Performance Counters Input Plugin and uses the PDH interface .
Get started 🔗
Follow these steps to configure and activate the component:
Deploy the Splunk Distribution of the OpenTelemetry Collector to your Windows host platform as described in Install the Collector for Windows with the installer script.
Configure the Windows Performance Counters receiver as described in the next section.
Restart the Collector.
Sample configuration 🔗
To activate the Windows Performance Counters receiver add a windowsperfcounters entry inside the receivers section of the Collector configuration file. For example:
receivers:
  windowsperfcounters:
    metrics:
      bytes.committed:
        description: the number of bytes committed to memory
        unit: By
        gauge:
    collection_interval: 30s
    perfcounters:
    - object: Memory
      counters:
        - name: Committed Bytes
          metric: bytes.committed
To complete the configuration, include the receiver in the metrics pipeline of the service section of your configuration file:
service:
  pipelines:
    metrics:
      receivers:
        - windowsperfcounters
To collect metrics from Windows performance counters, you need to define metrics using the metrics field as in the example. You can then reference the metrics you defined from the counters.metric fields.
View available performance counters 🔗
To see a list of available performance counters, use Windows PowerShell or the Windows Performance Monitor.
In PowerShell, run the following command to list all performance counter sets:
Get-Counter -ListSet *
To list the instances of each performance counter set, run the following command and replace <perf_object_name> with the name of the instances you want to find:
Get-Counter -List "<perf_object_name>"
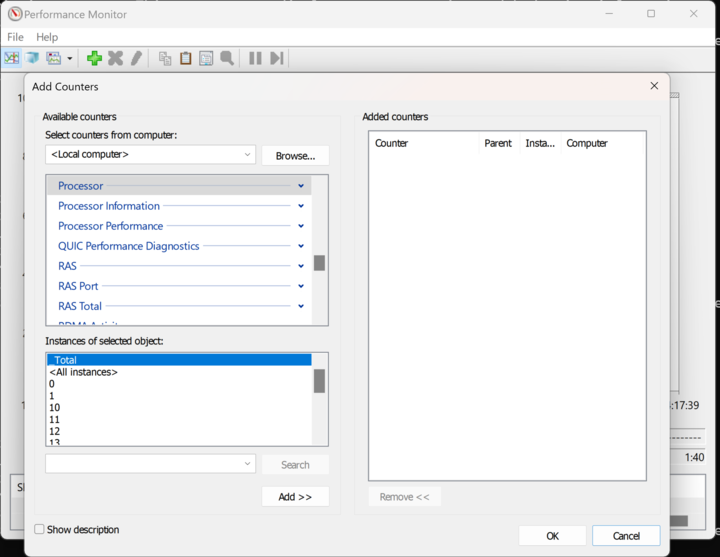
Run the following command to open the Windows Performance Monitor:
perfmon /sys
In the Windows Performance Monitor, select the green plus arrow to see a list of available performance counters.
Note the following:
If a specific performance counter can’t be accessed at startup, the receiver emits a warning and continues execution.
Some performance counters might not exist on some systems due to different OS configuration.
Advanced configuration 🔗
Configure collection interval and counters 🔗
You can configure the collection interval and which performance counters you want to scrape. For example:
windowsperfcounters:
  collection_interval: <duration>
  initial_delay: <duration>
  metrics:
    <metric name 1>:
      description: <description>
      unit: <unit type>
      gauge: null
    <metric name 2>:
      description: <description>
      unit: <unit type>
      sum: null
      aggregation: <cumulative or delta>
      monotonic: <true or false>
  perfcounters:
  - object: <object name>
    instances:
      - <instance name>
    counters:
      - name: <counter name>
        metric: <metric name>
        attributes:
        <key>: <value>
Scrape at different collection intervals 🔗
The following example shows how to scrape performance counters using different collection intervals depending on the target:
receivers:
  windowsperfcounters/memory:
    metrics:
      bytes.committed:
        description: Number of bytes committed to memory
        unit: By
        gauge:
    collection_interval: 30s
    perfcounters:
      - object: Memory
        counters:
          - name: Committed Bytes
            metric: bytes.committed

  windowsperfcounters/processor:
    collection_interval: 1m
    metrics:
      processor.time:
        description: CPU active and idle time
        unit: "%"
        gauge:
    perfcounters:
      - object: "Processor"
        instances: "*"
        counters:
          - name: "% Processor Time"
            metric: processor.time
            attributes:
              state: active
      - object: "Processor"
        instances: ["0", "1"]
        counters:
          - name: "% Idle Time"
            metric: processor.time
            attributes:
              state: idle

  # ...

service:
  pipelines:
    metrics:
      receivers: [windowsperfcounters/memory, windowsperfcounters/processor]
Configure instances 🔗
An instance is any entity that produces performance data. Instances can have one or more counter values.
The receiver supports the following values through the instances field:
Value |
Interpretation |
|---|---|
Not specified |
This is the only valid value if the counter has no instances |
|
All instances, excluding |
|
The “total” instance, that aggregates the values of all other instances. For more information, see Total instance behavior and the aggregation counter |
|
Single instance |
|
Set of instances |
|
Set of instances including the total instance |
Total instance behavior and the aggregation counter 🔗
To avoid dropping the _Total instance, configure the receiver to collect it individually on its own metric, as in the following example:
windowsperfcounters:
  metrics:
    processor.time.total:
      description: Total CPU active and idle time
      unit: "%"
      gauge:
  collection_interval: 30s
  perfcounters:
    - object: "Processor"
      instances:
        - "_Total"
      counters:
        - name: "% Processor Time"
          metric: processor.time.total
Warning
When using an instance value of "*", if the counter uses a value other than _Total, make sure to avoid double counting when aggregating metrics after the receiver scrapes them.
Recreate the query on every scrape 🔗
On some versions of Windows, Counters are sometimes corrupted and continuously return invalid data after the first scrape. If this happens, set the counter setting recreate_query to true (defaults to false) to tell the receiver to recreate the PDH query on every scrape. This might affect performance but should be inconsequential unless collection_interval is very high.
If re-creating the query fails, the previous query will be re-used and an error will be logged.
Define metric format 🔗
Configured metrics consist of a metric description, including unit and type, used by one or more performance counters scraped by the receiver.
To report metrics in a specific format, define the metric and reference it in the corresponding counter, along with any applicable attributes. By default, the metric name corresponds to the name of the counter.
Metrics can be of type sum or gauge. Sum metrics support the aggregation and monotonic fields.
Field |
Description |
Value |
Default |
|---|---|---|---|
|
Metric key or name. Can be any non empty string. |
String |
Name of the counter |
|
Description of the metric or measurement |
String |
|
|
Unit of measurement |
String |
|
|
Representation of a sum metric |
Sum configuration |
|
|
Representation of a gauge metric |
Gauge configuration |
Sum metrics 🔗
The following settings apply to sum metrics:
Field |
Description |
Value |
|---|---|---|
|
Type of aggregation temporality for the metric |
|
|
Whether the metric value can decrease |
|
Gauge metrics 🔗
The gauge configuration doesn’t accept settings. It is specified as an object for forwards compatibility.
The following example emits the Memory/Committed Bytes counter as the bytes.committed metric:
receivers:
  windowsperfcounters:
    metrics:
      bytes.committed:
        description: the number of bytes committed to memory
        unit: By
        gauge:
    collection_interval: 30s
    perfcounters:
    - object: Memory
      counters:
        - name: Committed Bytes
          metric: bytes.committed

service:
  pipelines:
    metrics:
      receivers: [windowsperfcounters]
Known limitations 🔗
The network interface is not available inside the container and as a result metrics for the object
Network Interfacearen’t generated in that scenario. If there is a sub-process it capturesNetwork Interfacemetrics.The counter category
Processis unreliable with multiple instances of the same process.For Windows 11 and higher, use
Process V2instead as it includes the process ID in the instance name.For versions prior to Windows 11, you can configure the
Processcounter category to include the PID in the instance name. Learn more at Microsoft’s doc Handling Duplicate Instance Names .
Settings 🔗
The following table shows the configuration options for the Windows Performance Counters receiver:
Troubleshooting 🔗
If you are a Splunk Observability Cloud customer and are not able to see your data in Splunk Observability Cloud, you can get help in the following ways.
Available to Splunk Observability Cloud customers
Submit a case in the Splunk Support Portal .
Contact Splunk Support .
Available to prospective customers and free trial users
Ask a question and get answers through community support at Splunk Answers .
Join the Splunk #observability user group Slack channel to communicate with customers, partners, and Splunk employees worldwide. To join, see Chat groups in the Get Started with Splunk Community manual.