Histogram metrics in Splunk Observability Cloud 🔗
Splunk Observability Cloud supports histogram data. You can use the histogram metric data you send from instrumented applications and services to Splunk Observability Cloud to create charts, detectors, and more.
Understanding histograms 🔗
A histogram represents the distribution of observations. Histograms require numerical, continuous values. Examples of continuous values include time, size, or temperature. The following chart is a visual representation of a histogram for response times in milliseconds:
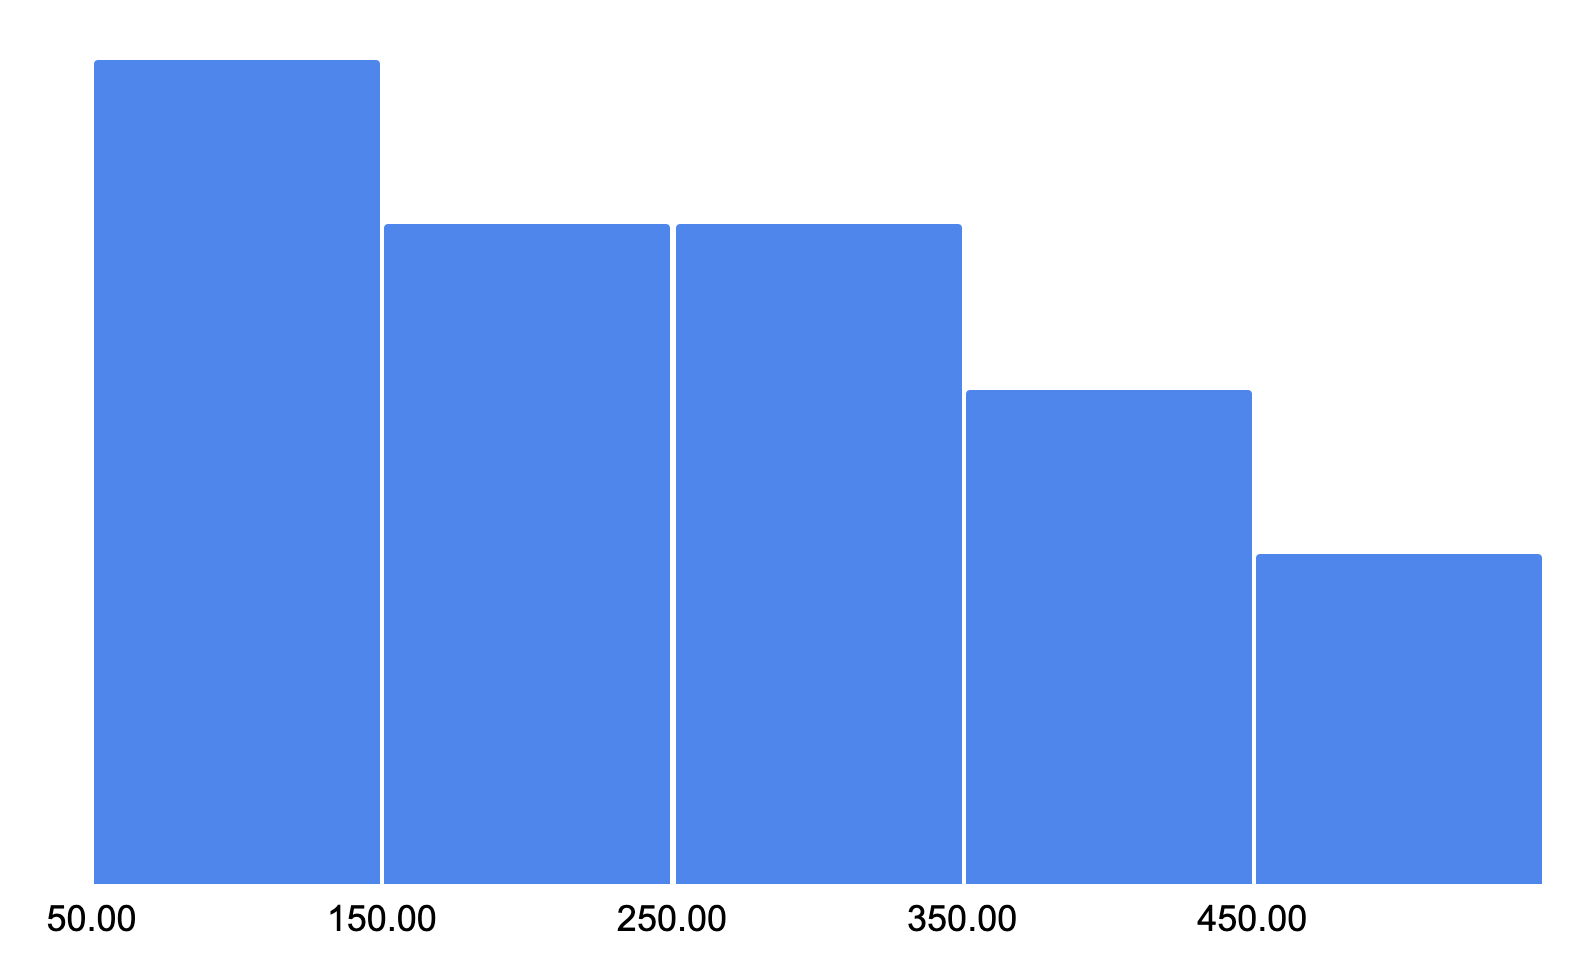
Histograms store data in buckets, which are adjacent intervals with numeric boundaries. The buckets or bars in the previous histogram span 100 milliseconds. The size of each bar is determined by the number of observations inside each interval. The higher the bar, the more data points fall within the interval.
You can calculate the total number of observations, the minimum and maximum value, the sum of all values, the average value, and discrete percentile values in every histogram. Splunk Observability Cloud provides a SignalFuse function for histograms, which you can use to customize histograms or perform calculations on the data.
Histograms are useful to compare different datasets at a glance, and to identify trends in your data that might be otherwise hard to detect. For example, histograms can answer questions like “What was the 90th percentile of response time for the database yesterday?”
When to use histogram metrics 🔗
Histograms can summarize data in ways that are difficult to reproduce using other metrics. With histogram buckets, you can explore the distribution of your continuous data over time without needing to analyze the entire dataset to see all of the data points. Histograms can combine multiple statistics into a single datapoint, such as sum, min, max, and count, along with the buckets.
Service level objectives (SLO) 🔗
Histograms are particularly suited for representing performance and availability service level objectives (SLO). Examples of availability SLOs are checking whether a percentile n of all requests is processed in less than a certain duration or that a percentile n of screens in your app loads successfully.
Unlike metrics covering a single percentile or quantile, histograms contain the percentiles or quantiles you need to track in a single metric. This facilitates exploring data in depth after initial detections. For example, if you get an alert for the 99th percentile for response time, using histograms you can explore other percentiles.
See Introduction to service level objective (SLO) management in Splunk Observability Cloud for more information.
Histogram instead of calculated metrics 🔗
Histograms contain data that you can use to calculate percentiles and other statistics in Splunk Observability Cloud instead of calculating them using your infrastructure. Sending histograms also results in fewer MTS sent, which reduces your subscription usage.
For example, if you’re sending the service.response_time.upper_90 and service.response_time.upper_95 metrics to track the response time of a key service in your infrastructure at the 90th and 95th percentiles, you can send histogram data for the entire distribution of response times, eliminating the need of sending 2 separate MTS.
Explicit bucket histograms 🔗
Explicit bucket histograms are histograms with predefined bucket boundaries. The advantage of defining bucket boundaries yourself is that you can use limits that make sense in your situation.
For example, the following Java code creates an OpenTelemetry histogram with explicit bucket boundaries:
void exampleWithCustomBuckets(Meter meter) {
   DoubleHistogramBuilder originalBuilder = meter.histogramBuilder("people.ages");
   ExtendedLongHistogramBuilder builder = (ExtendedLongHistogramBuilder) originalBuilder.ofLongs();
   List<Long> bucketBoundaries = Arrays.asList(0L, 5L, 12L, 18L, 24L, 40L, 50L, 80L, 115L);
   LongHistogram histogram =
      builder
            .setAdvice(advice -> advice.setExplicitBucketBoundaries(bucketBoundaries))
            .setDescription("A distribution of people's ages")
            .setUnit("years")
            .build();
   addDataToHistogram(histogram);
}
Note
Currently, Splunk Observability Cloud supports only explicit bucket histograms.
Get histogram data into Splunk Observability Cloud 🔗
For instructions on how to get histogram data into Splunk Observability Cloud and how to migrate existing reporting elements, see Get histogram data into Splunk Observability Cloud.