Splunk RUM built-in dashboards 🔗
Built-in dashboards offer charts, metrics, and aggregations about your applications.
Dashboard |
Type of data |
|---|---|
Mobile app health |
|
Browser app health |
|
Browser page health |
|
Built-in dashboard use cases 🔗
The following use cases feature examples from Buttercup Industries, a fictitious e-commerce company.
Troubleshoot from a built-in dashboard 🔗
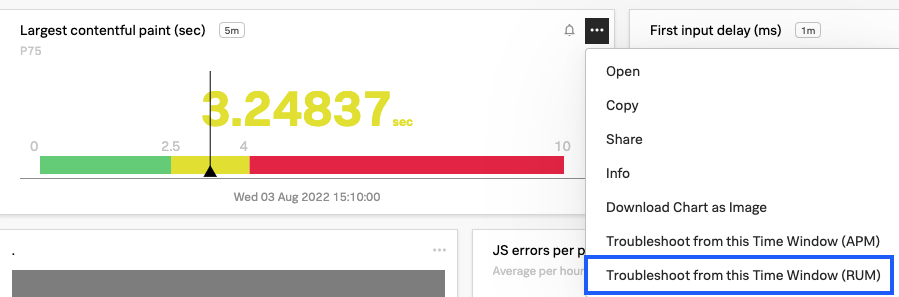
Kai, a site reliability engineer at Buttercup Industries, uses Splunk RUM for Browser to identify performance bottlenecks and monitor Web Vitals so that they can troubleshoot customer facing issues on the Buttercup Industries website. Kai uses built-in dashboards to get a high level assessment of the health of the Buttercup Industries applications. They open RUM through the Troubleshoot from this time window to dig into the data. For example, if Kai wants to explore traffic by Browser type, they can explore more data in Splunk RUM like this:
Review a larger time range of data 🔗
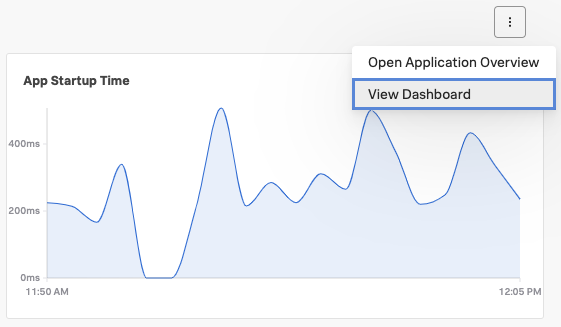
Kai, a site reliability engineer at Buttercup Industries, uses Splunk RUM for Mobile to monitor releases, find root causes of user reported issues, and measure important metrics. Kai looks at the Application summary dashboard to see an overview of mobile performance metrics. If Kai sees a troublesome trend, they can open the built-in dashboard to see a longer period of time for the data they’re interested in. Data from RUM is retained for 8 days. Data from a built-in dashboard is kept for 13 months. For more on data retention, see Data retention in Splunk Observability Cloud.
Dashboards for alerts and detectors 🔗
To create charts and dashboards for your RUM alerts and detectors, see: