Scenario: Alex monitors service performance using endpoint performance 🔗
Alex, a performance engineer at Buttercup Games, wants to monitor and optimize the Buttercup Games customer experience to proactively prevent incidents. Today, Alex is particularly interested in the checkout workflow since they released enhancements to the process this morning.
To review the performance of the checkout experience, Alex takes the following steps in Splunk APM:
Alex reviews the endpoints in the Endpoint Performance card 🔗
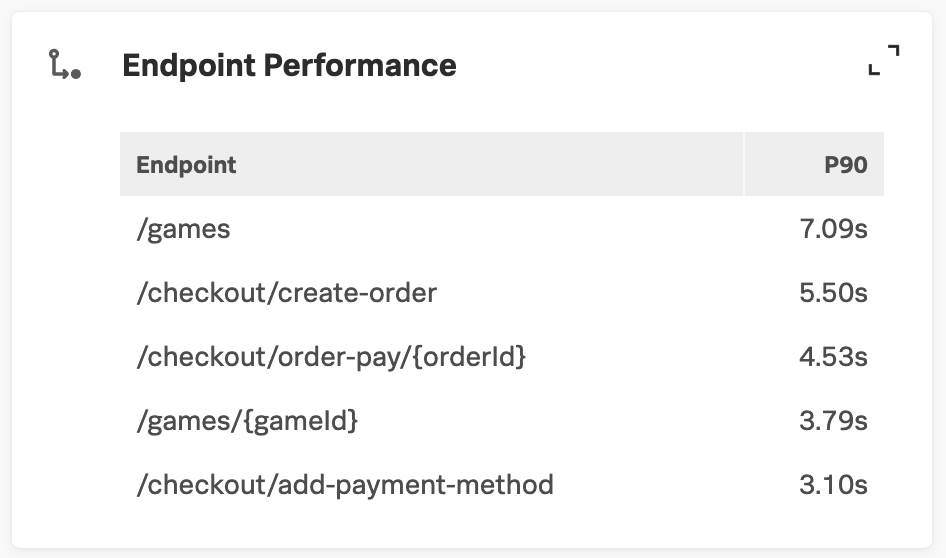
Alex opens the dependency map in APM. Because the Buttercup Games app uses a monolith architecture, they can’t drill down into a component service using the dependency map. So, Alex reviews the Endpoint Performance card and notices there are checkout endpoints listed in the Endpoint Performance card that show a P90 latency of over 2 seconds.

Alex sorts and filters endpoints in Endpoint Performance 🔗
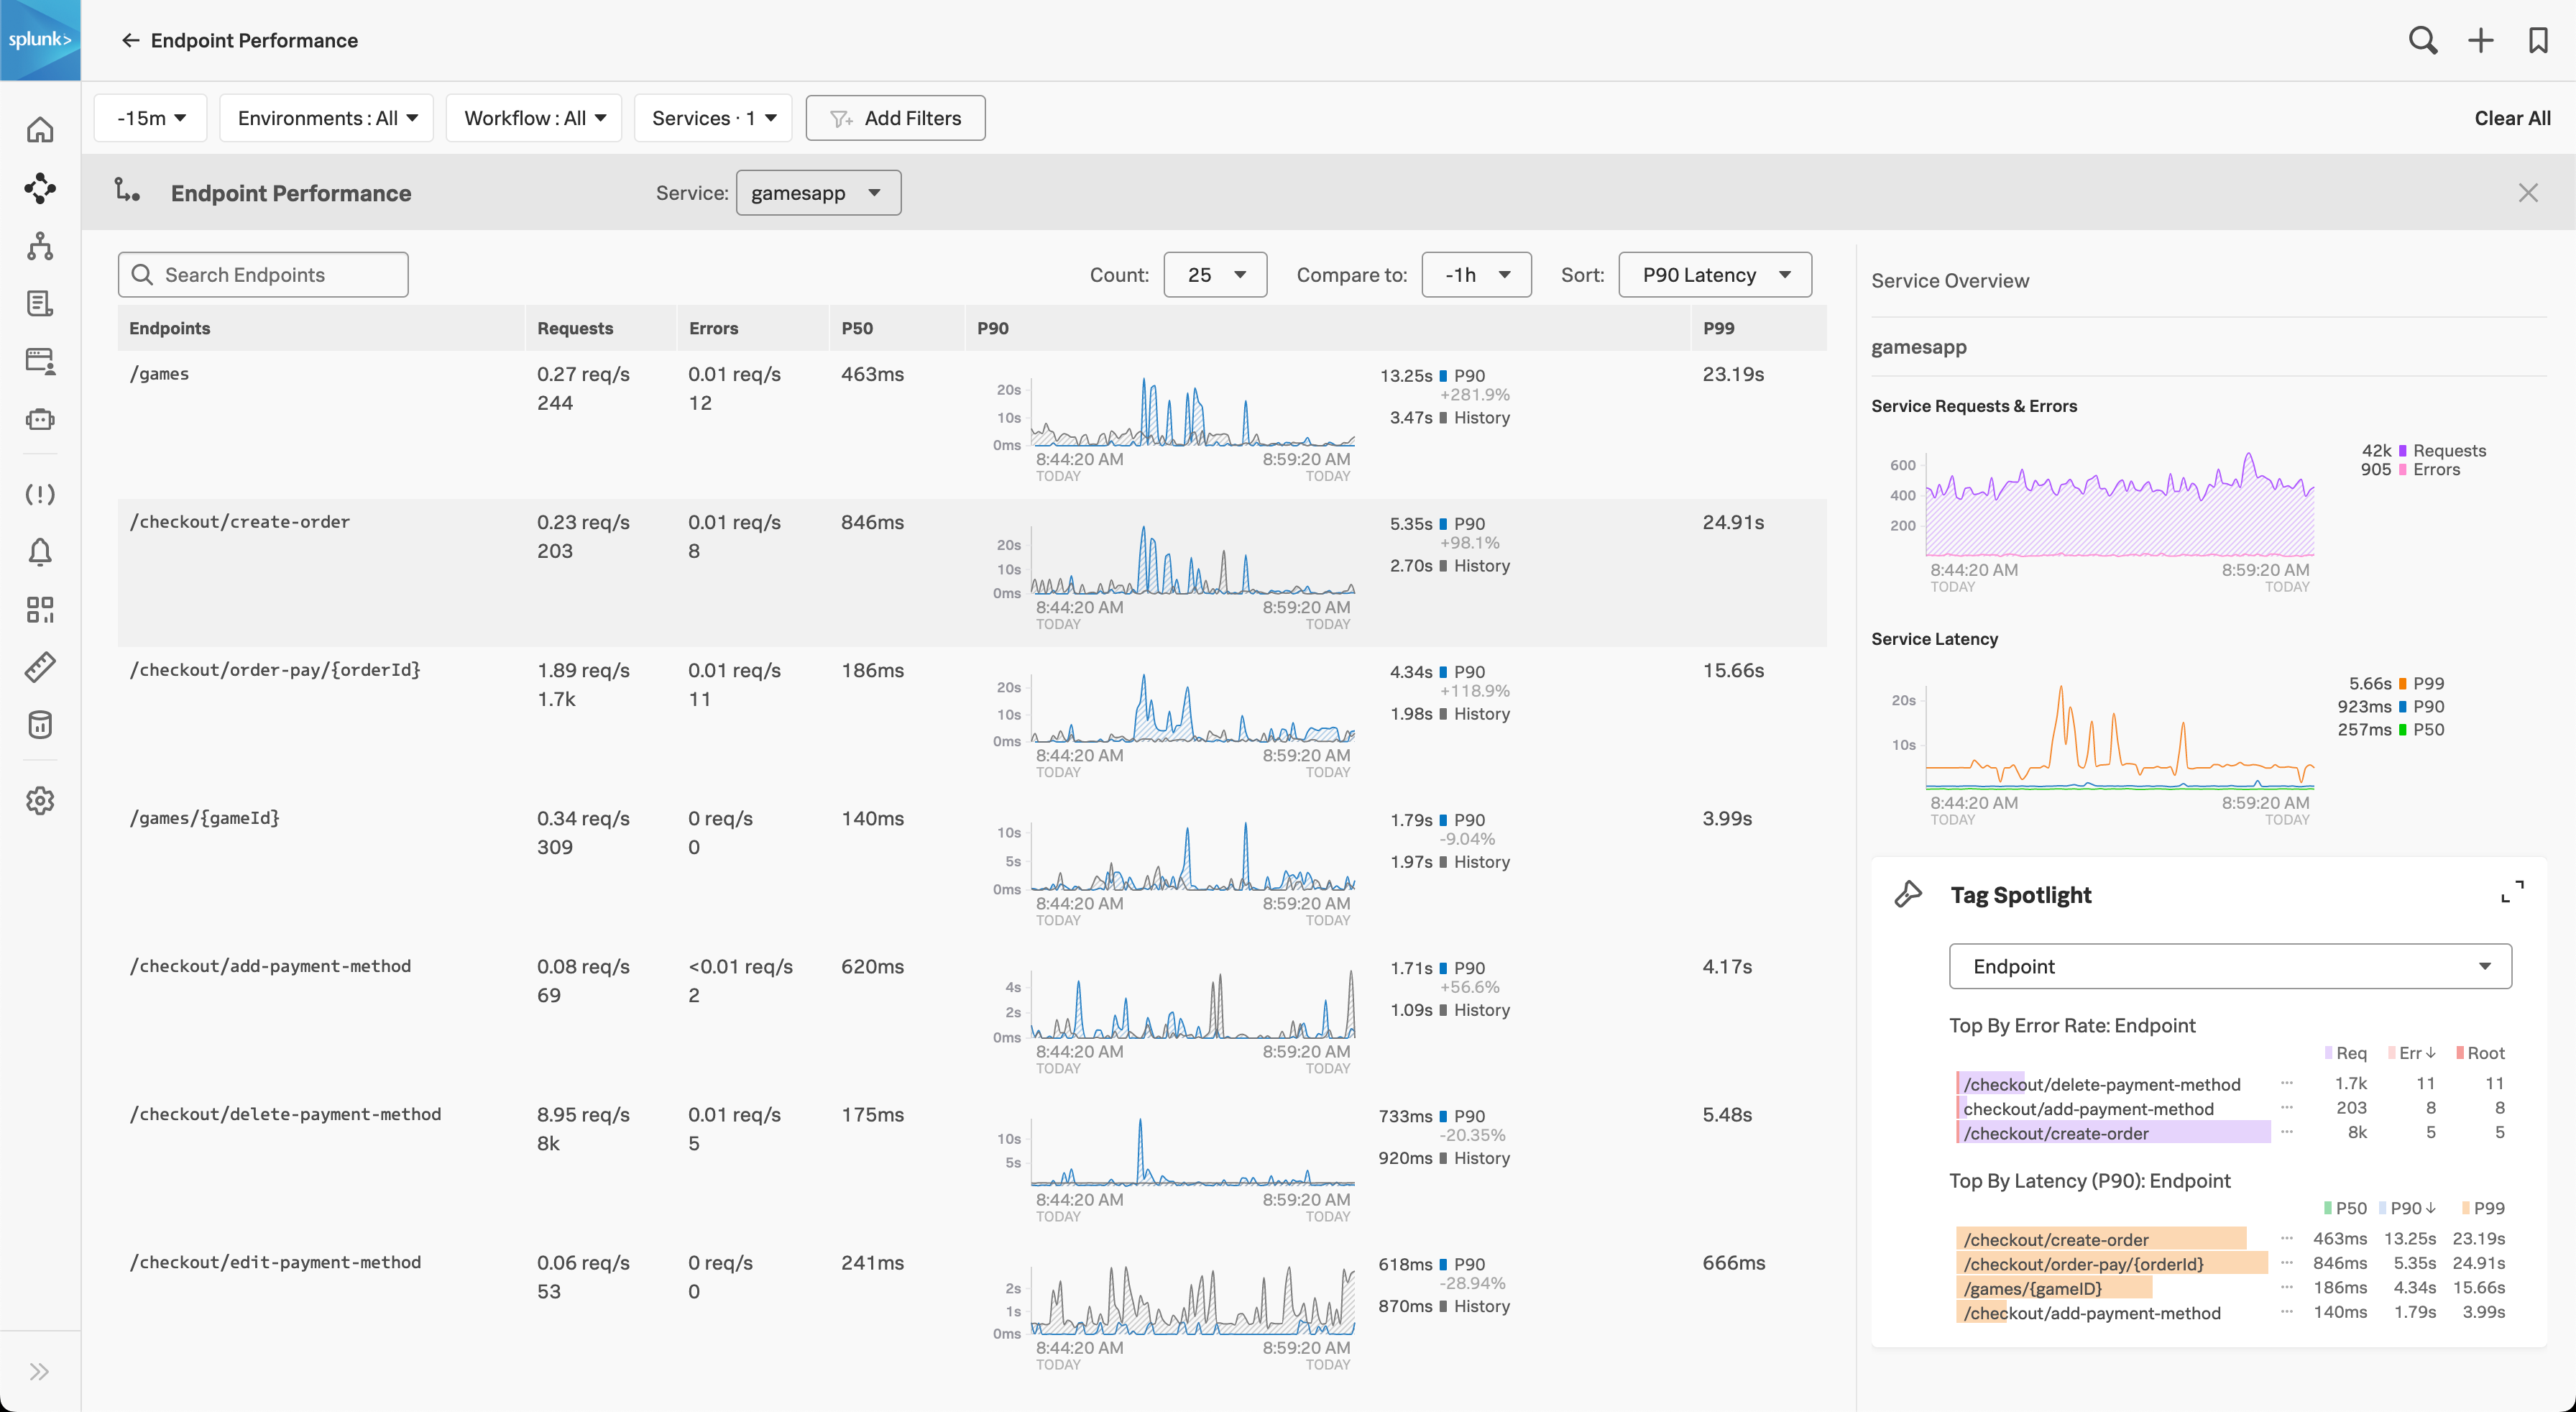
Alex selects the Endpoint Performance card to go to the full Endpoint Performance page to get more details about which checkout endpoints are taking longer than 2 seconds.

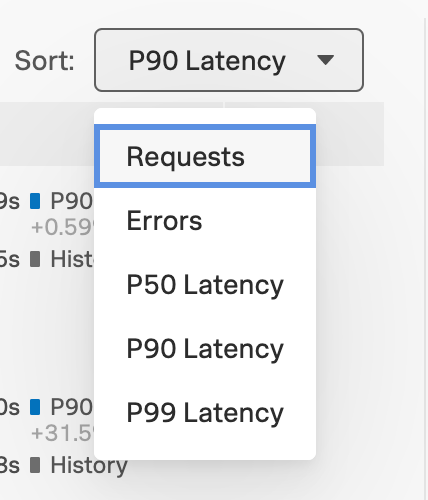
Within Endpoint Performance, Alex sorts the endpoints by P90 Latency so they can quickly see the endpoints with the highest latency.

Alex also uses the search to filter to endpoints with /checkout/ in the path.

Alex compares the last hour’s performance to the same hour from yesterday 🔗
Alex knows there was a release this morning, so they update the time dropdown to -1h and select -24h for the comparison so that they can compare the last hour to the same time frame yesterday.

Alex notices that the checkout/{cardId} endpoint has a 110% increase in P90 latency compared with the same hour yesterday.

Alex uses Tag Spotlight to get more context 🔗
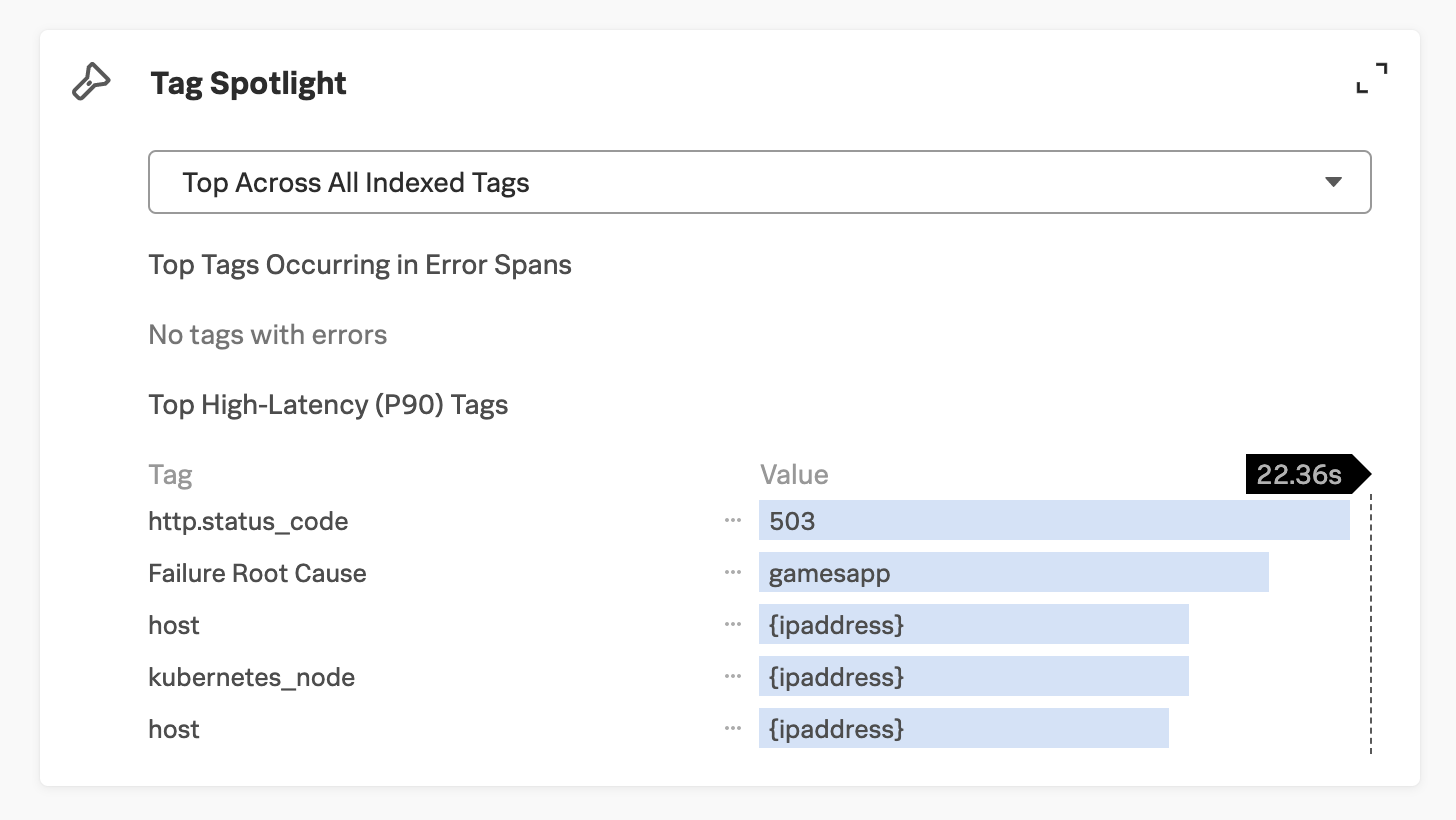
Alex selects this endpoint and reviews the Tag Spotlight details. Alex notices that an http.status_code 503 is the top high-latency tag. Alex selects this tag to explore in Tag Spotlight.

In Tag Spotlight, Alex locates the 503 status codes and adds a filter to Tag Spotlight for 503 responses. Now they can see that the latest version released today is responsible for the majority of the 503 responses. Having identified some latency associated with the 503 responses in the latest version, Alex consults with their team regarding the cause of the 503 responses.
Summary 🔗
Alex used Endpoint Performance to monitor endpoints within their monolith. Using the filter, sort, and compare functionality within the Endpoint Performance they were able to quickly isolate an endpoint that had increased latency after a release.
Learn more 🔗
For details about Tag Spotlight, see Analyze service performance with Tag Spotlight.
For a list of APM key concepts, see Key concepts in Splunk APM.
For more Splunk APM scenarios, see Scenarios for troubleshooting errors and monitoring application performance using Splunk APM.