Connect to AWS with Splunk-managed Metric Streams 🔗
If you have Administrator privileges for Splunk Observability Cloud and your Amazon Web Services (AWS) account, you can use the UI guided setup to create an integration to connect to AWS and configure metric collection.
Before you start 🔗
Before you proceed, check AWS authentication, permissions, and supported regions and Connect AWS to Splunk Observability Cloud for information on data collection intervals and costs.
For alternative connection methods, see:
Use the guided setup to connect to AWS 🔗
To access the guided setup for the AWS integration, perform the following steps:
Log in to Splunk Observability Cloud.
Open the Amazon Web Services guided setup . Optionally, you can navigate to the guided setup on your own:
On the navigation menu, select .
Go to the Available integrations tab, or select Add Integration in the Deployed integrations tab.
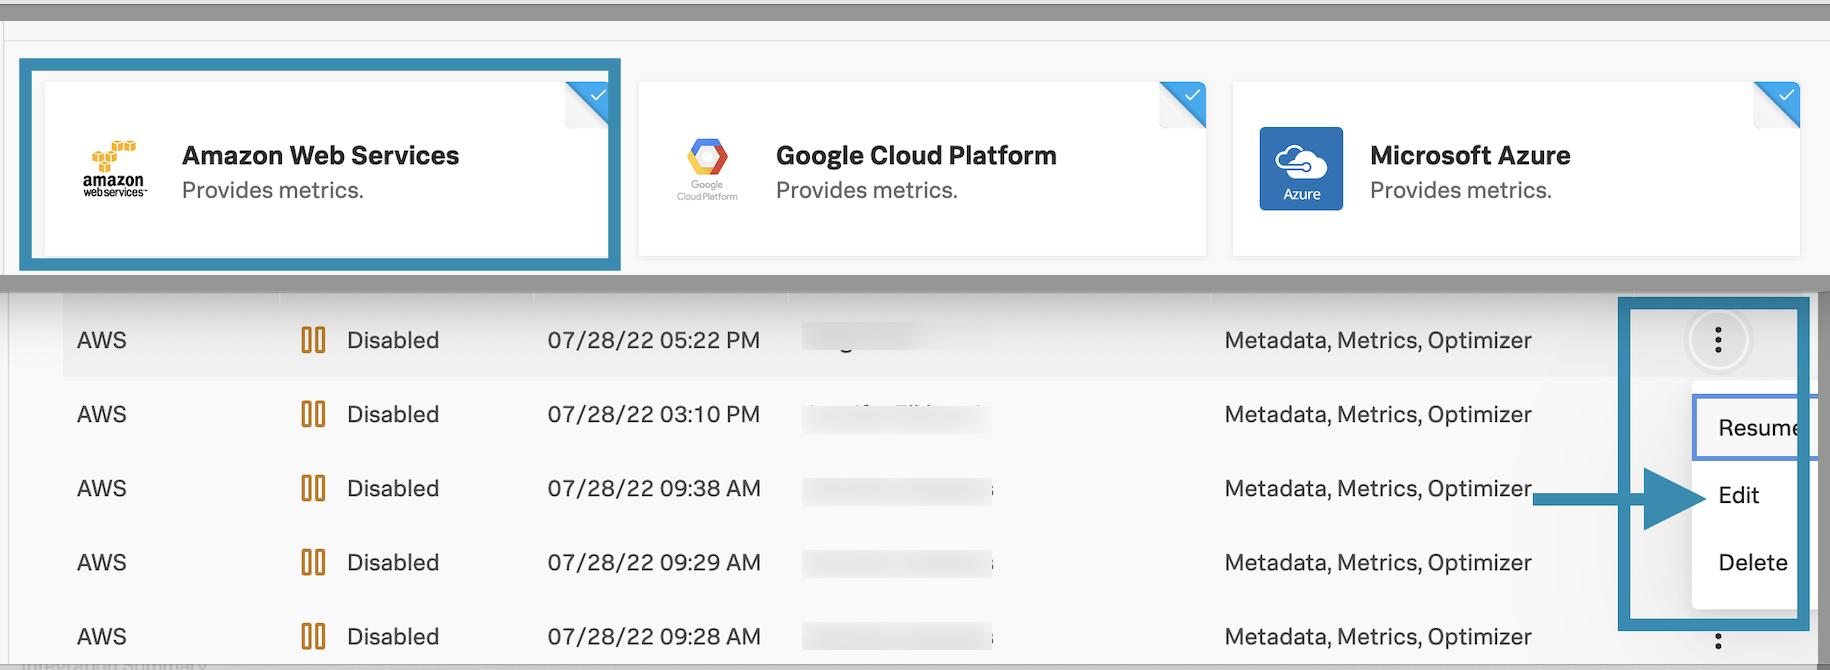
Select the tile for Amazon Web Services.
Next, follow the steps provided in the guided setup:
Define your AWS connection 🔗
In this step you need to choose the following connection options:
Overall region: The region AWS from which AWS manages your resources. See Supported AWS regions for more information.
Authentication type: How you will authenticate to connect with AWS. Learn more at Authenticate in AWS using an External ID (recommended).
Data types: Select which types of data to ingest.
Metadata.
Cost and usage metrics.
CloudWatch metrics.
In the CloudWatch metrics option, select Streaming (Splunk-managed) as the ingestion method. When you activate Metric Streams, make sure you add these additional permissions to your IAM policy.
Note
To collect logs, see Send AWS logs to Splunk Platform.
Kinesis Firehose connection options 🔗
To create Kinesis Firehose and other resources required to connect to AWS using Splunk-managed Metric Streams you can use one of these two options:
CloudFormation template. Learn more at Use CloudFormation to connect to Splunk Observability Cloud.
Terraform template. Learn more at Use the Terraform template to connect to Splunk Observability Cloud. The provided Terraform template supports Metric Streams only, and does not offer log support.
Prepare your AWS account 🔗
In this step, switch to your AWS Console to prepare for authentication.
On this screen, Splunk Observability Cloud gives you the AWS IAM policy JSON snippet, your Splunk Observability Cloud account ID and your External ID, which you’ll need to define your authenticaton policies in the console.
See more details in Authenticate in AWS using an External ID (recommended).
Establish the connection 🔗
Finally, proceed with the last steps:
Complete your authentication configuration as prompted.
Select your data sources:
AWS Regions
Built-in and custom services.
Note
Select All built-in services to import all data from built-in CloudWatch namespaces and ensure that built-in dashboards display automatically.
Review the default settings 🔗
After creating an AWS IAM policy and assigning it to a particular role through the guided setup you can modify your configuration.
Modify the scope of data collection 🔗
By default Splunk Observability Cloud brings in data from all supported AWS services associated with your account, with certain limitations. See Supported integrations in Splunk Observability Cloud. Splunk Observability Cloud also brings in 5 default stats per service: SampleCount (count in Splunk Observability Cloud), Average (mean), Sum (sum), Minimum (lower), and Maximum (upper).
Use the check box options in the guided setup to limit the scope of your data collection. These are the available options:
Collect Amazon Cost and Usage Metrics.
Ingest CloudWatch Metrics. You can deactivate it altogether, or deactivate the polling but activate AWS Metric Streams instead.
Select which AWS regions to fetch data from.
Select which AWS services to fetch data from.
To limit data collection, you can also:
Manage the amount of data to import. See Control the data and metadata to import.
In the Data Management menu in Splunk Observability Cloud, edit any integration to limit data import.
Use the AWS console to revise the contents of the
ActionandResourcefields.
Select a CloudFormation template 🔗
Select a CloudFormation template to collect Metric Streams for each AWS region that you want to operate in.
Next steps 🔗
After you connect Splunk Observability Cloud with AWS, you can use Splunk Observability Cloud to track a series of metrics and analyze your AWS data in real time.
See the AWS official documentation for a list of the available AWS resources.
See how to leverage data from integration with AWS for more information.