Connect Splunk Observability Cloud with AWS-managed Metric Streams 🔗
Amazon CloudWatch supports a quick setup experience for AWS Partner destinations in the CloudWatch Metric Streams console. With this simplified getting-started experience you can create a Metric Stream to Splunk Observability Cloud in a single step.
Before you start 🔗
Before you proceed, check AWS authentication, permissions, and supported regions and Connect AWS to Splunk Observability Cloud for information on data collection intervals and costs. When setting up your configuration in the AWS console, keep in mind that Splunk Observability Cloud only supports OpenTelemetry 0.7 and 1.0.
For alternative connection methods, see:
Note
You can only have one integration using Metric Streams externally managed from AWS at a time for each AWS account. All Metric Streams you created in different AWS regions will be sent to this integration. Editing included regions will affect metadata, and might impact how corresponding metric streams are located and displayed in Splunk Observability Cloud features such as dashboards.
Start the connection to AWS in the Splunk console guided setup 🔗
To access the guided setup for the AWS integration, perform the following steps:
Log in to Splunk Observability Cloud.
Open the Amazon Web Services guided setup . Optionally, you can navigate to the guided setup on your own:
On the navigation menu, select .
Go to the Available integrations tab, or select Add Integration in the Deployed integrations tab.
Select the tile for Amazon Web Services.
Next, follow the steps provided in the guided setup:
Define your AWS connection 🔗
In this step you need to choose the following connection options:
Overall region: The region AWS from which AWS manages your resources. See Supported AWS regions for more information.
Authentication type: How you will authenticate to connect with AWS. Learn more at Authenticate in AWS using an External ID (recommended).
Data types: Select which types of data to ingest.
Metadata.
Cost and usage metrics.
CloudWatch metrics.
In the CloudWatch Metrics option, select Streaming (AWS-managed) as the ingestion method, and proceed to the AWS console to complete the connection.
Note
To collect logs, see Send AWS logs to Splunk Platform.
Prepare your AWS account 🔗
On this screen, Splunk Observability Cloud gives you:
The AWS IAM policy JSON snippet, your Splunk Observability Cloud account ID and your External ID, which you’ll need to define your authenticaton policies in the console. See more details in Authenticate in AWS using an External ID (recommended).
The steps to create Metric Streams in the AWS console. See more at Connect to Splunk Observability Cloud from the AWS console.
To complete this step, switch to your AWS Console to prepare for authentication and create the Metric Stream to send your data to Splunk Observability Cloud. See Connect to Splunk Observability Cloud from the AWS console.
Establish the connection 🔗
Finally, proceed with the last steps:
Complete your authentication configuration as prompted.
Select your data sources:
AWS Regions.
Built-in and custom services.
Note
Select All built-in services to import all data from built-in CloudWatch namespaces and ensure that built-in dashboards display automatically.
Connect to Splunk Observability Cloud from the AWS console 🔗
Before you proceed to create your Metric Streams connection between your AWS and your Splunk Observability Cloud accounts in the AWS console, follow the steps in Start the connection to AWS in the Splunk console guided setup to ensure you have an active AWS integration in your associated Splunk Observability Cloud account:
Make sure you selected Streaming (AWS-managed) as the ingestion method in the integration.
To connect Splunk Observability Cloud from the AWS console, follow these steps:
In the AWS console, go to CloudWatch > Metrics > Streams, and select Create metric stream.
Next, select Quick AWS Partner setup as the destination.
In the drop down menu, select Splunk Observability Cloud.
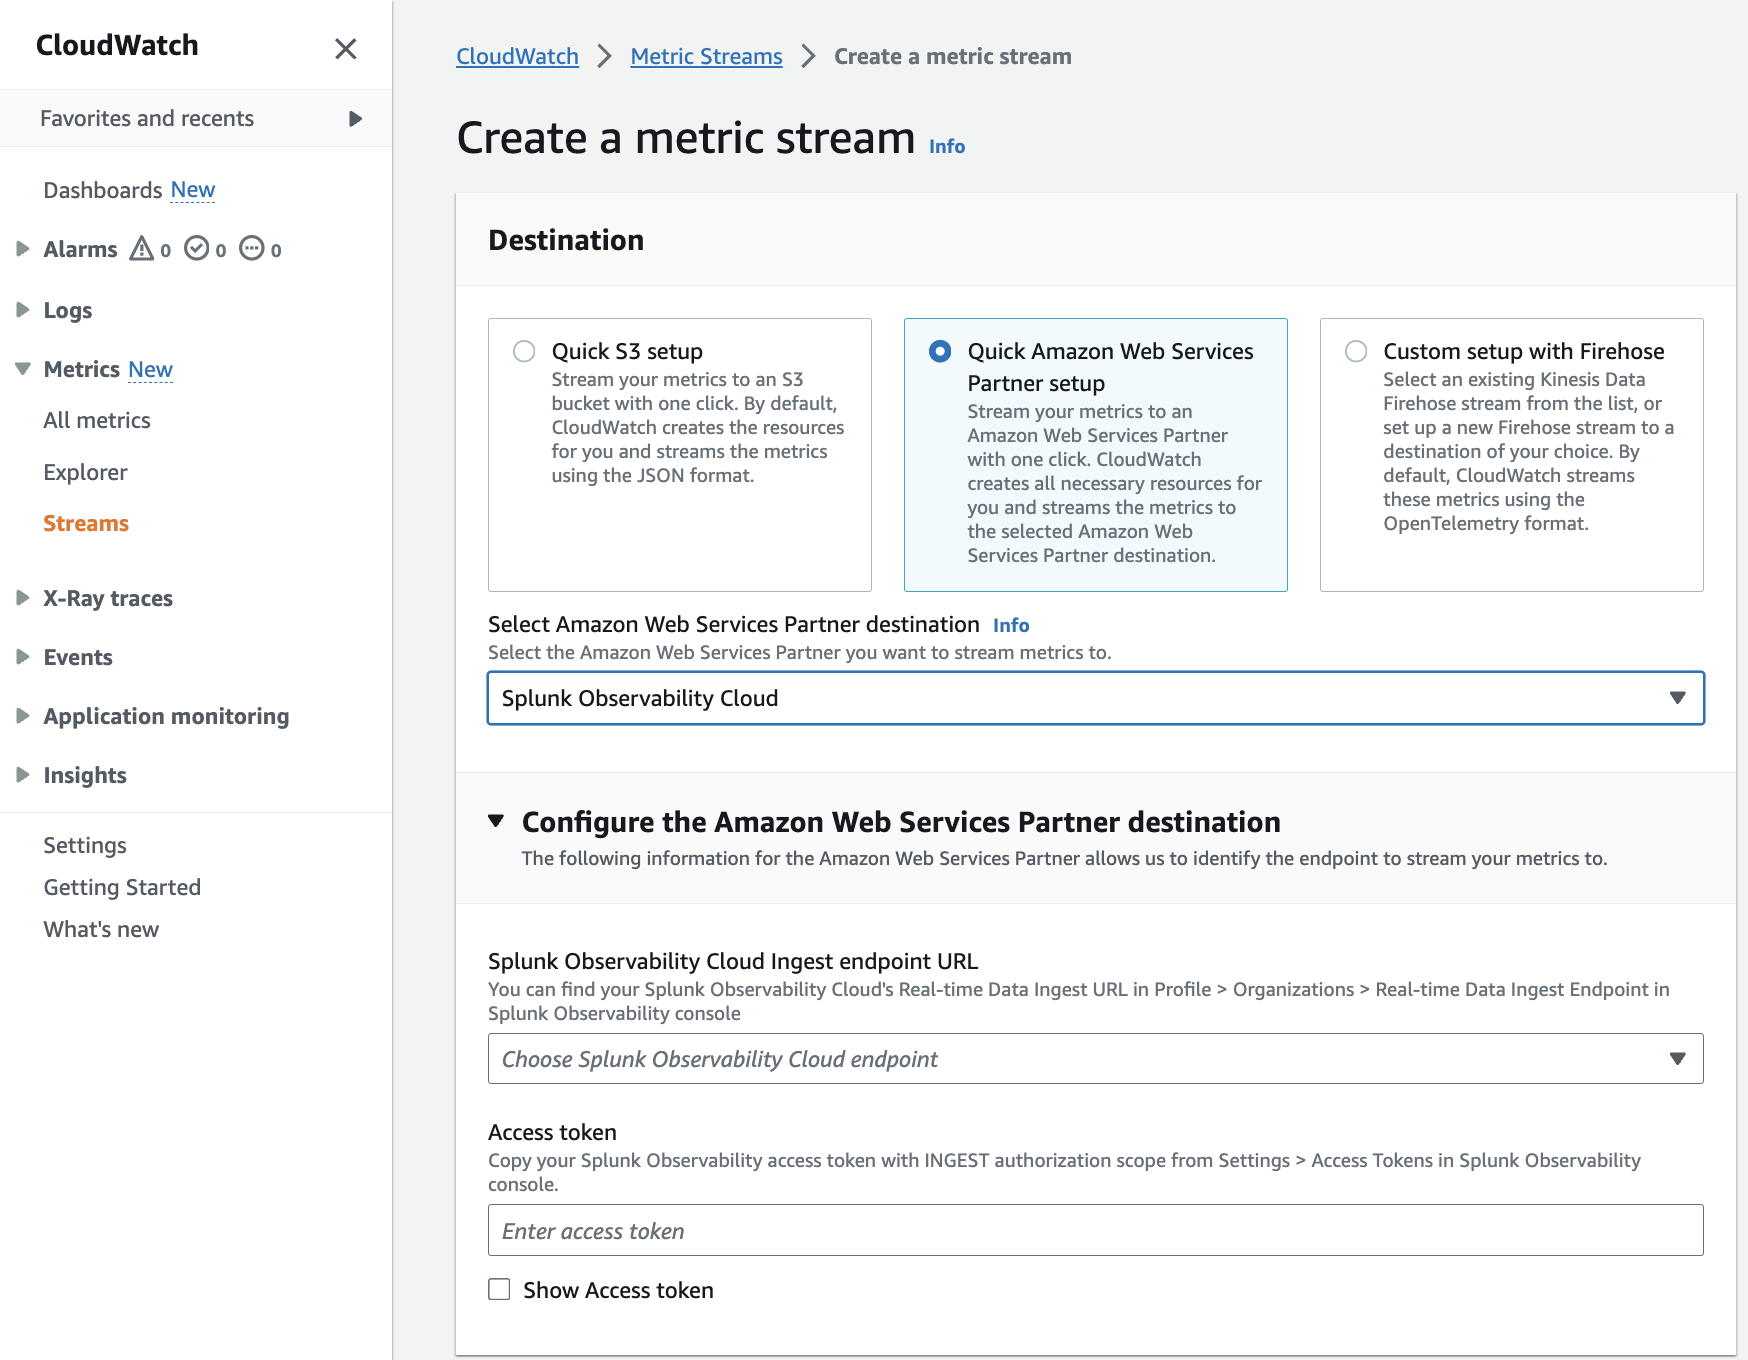
In the Configure the AWS Partner destination menu, select the Splunk Observability Cloud Ingest endpoints from the dropdown list. See Profile > Organizations > Real-time Data Ingest Endpoint in the Splunk Observability Cloud console for more information.
Fill in the access token by copying one of the access tokens with
INGESTauthorization scope from Settings > Access Tokens in the Splunk Observability Cloud console.You can leave the rest of the form as default, or customize the config according to your needs, such as filtering based on namespaces.
Integrate from the AWS console using the Splunk API 🔗
If you want to integrate from the AWS console using the Splunk Observability Cloud API, see Configure Metric Streams from the AWS console.
See also our API reference guide at Integrations .
Next steps 🔗
After you connect Splunk Observability Cloud with AWS, you can use Splunk Observability Cloud to track a series of metrics and analyze your AWS data in real time.
See the AWS official documentation for a list of the available AWS resources.
See how to leverage data from integration with AWS for more information.