Part 1: Install the Collector and locate the configuration file 🔗
In Part 1 of this tutorial, start by installing the Splunk Distribution of OpenTelemetry Collector using the Linux installer script. The installer deploys default configuration files that you can modify using any text editor.
See Tutorial: Configure the Splunk Distribution of OpenTelemetry Collector on a Linux host for an overview of the tutorial.
Install the Collector for Linux 🔗
In a terminal session, define the following environment variables:
export SPLUNK_REALM="<splunk_o11y_cloud_realm>"
export SPLUNK_ACCESS_TOKEN="<splunk_access_token>"
export SPLUNK_MEMORY_TOTAL_MIB="512"
The value of the SPLUNK_REALM variable is the Splunk Observability Cloud realm, for example, us0. To find the realm name of your account, follow these steps:
Open the navigation menu in Splunk Observability Cloud.
Select .
Select View Profile under you username.
Locate the realm name in the Organizations section.
To obtain an access token, see Retrieve and manage user API access tokens using Splunk Observability Cloud.
After you set the environment variables, run the following command in the same terminal session to download and run the Linux installer script:
curl -sSL https://dl.signalfx.com/splunk-otel-collector.sh > /tmp/splunk-otel-collector.sh;
sudo sh /tmp/splunk-otel-collector.sh --realm $SPLUNK_REALM --memory $SPLUNK_MEMORY_TOTAL_MIB -- $SPLUNK_ACCESS_TOKEN
Wait until the following message appears:
The Splunk OpenTelemetry Collector for Linux has been successfully installed.
Note
You can generate a prefilled install command using the Collector guided setup in Splunk Observability Cloud.
Check that data is coming into Splunk Observability Cloud 🔗
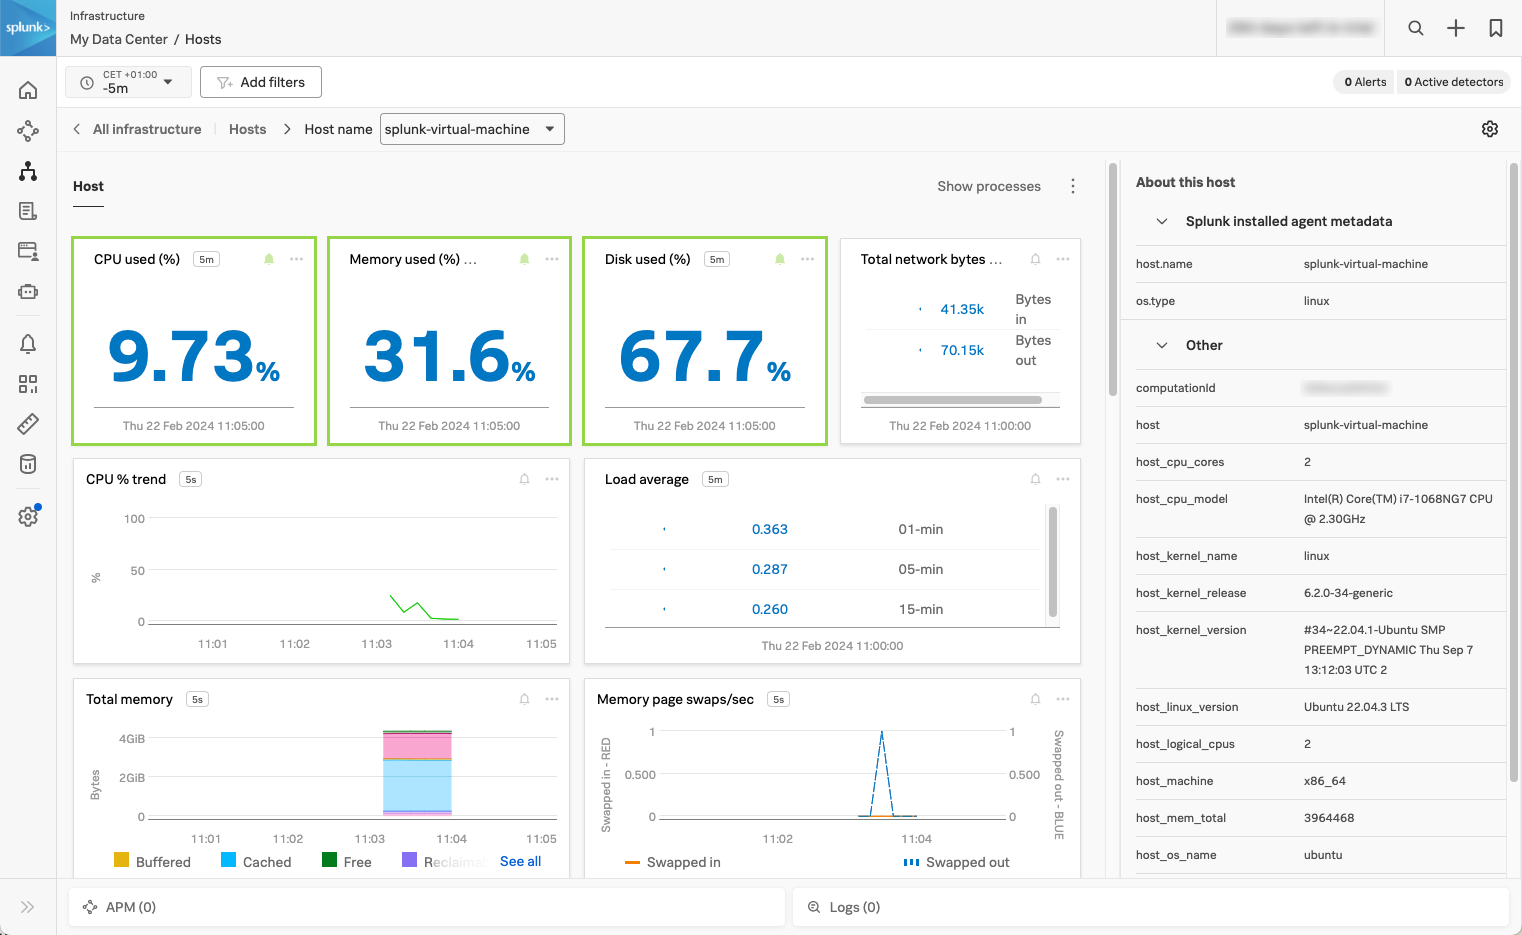
Open Splunk Observability Cloud and go to Infrastructure to see the data coming from your Linux machine. The following screenshot shows typical host metrics coming into Splunk Observability Cloud, such as CPU load, disk usage, and the list of processes running on the host.
Locate the configuration files 🔗
After you’ve installed the Collector, navigate to /etc/otel/collector to find the configuration files. List the files to see a result similar to the following:
.
|-- agent_config.yaml
|-- config.d
|-- fluentd
|-- gateway_config.yaml
|-- splunk-otel-collector.conf
|-- splunk-otel-collector.conf.example
`-- splunk-support-bundle.sh
The agent_config.yaml and gateway_config.yaml files contain the configuration for deploying the Collector in host monitoring or data forwarding modes. The structure and mode of configuration is the same regardless of the deployment mode. In this tutorial, you configure the Collector as an agent, so you’ll be using the agent_config.yaml file.
The splunk-otel-collector.conf file contains the environment variables for systemd, including the Splunk Observability Cloud access token and the Splunk Observability Cloud realm. When running the Collector as a service, make sure this file contains the correct values.
Create a sample configuration file 🔗
All Collector configurations consists of the following components described in YAML format:
Receivers: Collect telemetry from 1 or more sources.
Processors: Modify or transform data before sending it to exporters.
Exporters: Send data to observability back ends or other destinations.
Connectors: Join 2 pipelines, acting as both exporter and receiver.
Extensions: Accessories that expand the capabilities of the Collector.
When configuring the Collector for your own use case, you often need to edit or create Collector configuration files that combine all the previous components.
Use your favorite code or text editor to create a new configuration file. Save the file as sample.yaml and add the following section, which describe a receiver, a processor, an exporter, and an extension:
extensions:
  health_check:
    endpoint: "${SPLUNK_LISTEN_INTERFACE}:13133"

receivers:
  otlp:
    protocols:
      grpc:
        endpoint: "${SPLUNK_LISTEN_INTERFACE}:4317"
      http:
        endpoint: "${SPLUNK_LISTEN_INTERFACE}:4318"

processors:
  batch:

exporters:
  otlp:
    endpoint: "${SPLUNK_GATEWAY_URL}:4317"
    tls:
      insecure: true
All components are connected in pipelines through the special service section. Add the following fragment at the end of the sample.yaml file:
service:
  pipelines:
    traces:
      receivers:
      - otlp
      processors:
      - batch
      exporters:
      - otlp
  # Extensions don't go inside pipelines
  extensions: [health_check]
Note
Ensure that each setting is indented with 2 or more spaces to respect YAML format conventions. Configuration errors are often a result of incorrect indentation.
To check if the previous Collector configuration file is valid, save the file as sample.yaml and pass it to the Collector using the validate command and the --config option, which tells the Collector what configuration to use:
otelcol validate --config=sample.yaml
You will see an output similar to the following response, indicating that the configuration is valid:
2024/02/19 16:28:44 settings.go:479: Set config to [sample.yaml]
2024/02/19 16:28:44 settings.go:532: Set ballast to 168 MiB
2024/02/19 16:28:44 settings.go:548: Set memory limit to 460 MiB
2024/02/19 16:28:44 settings.go:415: set "SPLUNK_LISTEN_INTERFACE" to "0.0.0.0"
Next step 🔗
This completes the first part of the tutorial. You have learned how the Collector configuration works and where it’s located.
To learn how to edit the Collctor configuration file to add new components, continue to Part 2: Edit the Collector configuration to add new components.
Learn more 🔗
To learn more about the Collector configuration format and structure, see the following resources: