Error monitoring and crash aggregation in Tag spotlight 🔗
Errors are aggregated based on the stack trace. The error stack trace contains the error type and error message in the body of the stack trace. The following table outlines the different ways errors are grouped together depending on the situation.
Situation |
How errors are grouped together |
|---|---|
Errors have a stack trace |
Errors are grouped by the hash ID of the stack trace |
Error groups are generated with a stack trace |
Errors are grouped by the hash ID of the message and error type |
Errors don’t have an error message |
Errors are grouped by the hash ID of the error type |
The error ID can represent:
hash ID of a stack trace
hash ID of a message
hash ID of the error type
Mobile crash aggregation 🔗
A crash happens when a user encounters an error and has to exit the app. App errors are all other types of errors that occur but don’t result in the user having to exit the app. For example, ANR (application not responding).
Explore top crashes across in Tag Spotlight 🔗
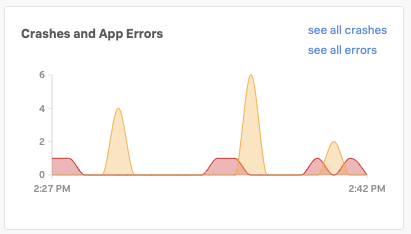
From the Splunk RUM overview dashboard, select See all on the Crashes and App Errors chart to open Tag Spotlight. In Tag Spotlight you can explore application based errors, metrics, and events.
To learn more about Tag Spotlight, see:
Get a top-down view of your services in Tag Spotlight for an orientation to Tag Spotlight
Scenario: Deepu finds the root cause of an error using Tag Spotlight for a specific scenario leveraging Tag Spotlight.
JavaScript error aggregation 🔗
The JavaScript Errors metric in RUM show the JavaScript errors (by error ID) which occur most often in your applications. The error ID is created by hashing the associated stack trace, error message, and error type. When you drill into an error, you can see the error type, the error message, associated stack trace, and the trend of the error frequency.
Find the top JavaScript errors across your applications in Tag Spotlight 🔗
In Splunk RUM, the JavaScript errors view shows the JavaScript errors sorted by page, whereas the metric JavaScript Errors (by error ID) shows the top ten JavaScript errors across your entire application. In the metric Frontend Errors by ErrorID the information is displayed by error type, error ID, then error message.
Open RUM. From the left navigation panel, select RUM and Browser as the source and the application you wan to monitor.
To open Tag Spotlight from either the Application Summary Dashboard, or Overview pages click on any metric.
For example, select See all in the metric JavaScript errors(by error ID) to explore all of the JavaScript errors in Tag Spotlight.
JS Errors without stacktrace, type, or message 🔗
Sometimes, you might see a message in the UI that says JavaScript error without a stacktrace, type, or message. This might happen because the error didn’t have any information about the stack trace before it was ingested by Splunk RUM. To troubleshoot, try narrowing in on a specific time range which shows the JS error only, and explore the related User sessions.
Learn more 🔗
For more examples on how you can use Tag Spotlight, see Scenario: Deepu finds the root cause of an error using Tag Spotlight.
To learn more about monitoring errors in Splunk RUM for browser, see the scenario Identify errors in browser spans.
For examples on working with tags, see Filter your data by tags in Splunk RUM