Select time range with the time range selector 🔗
The time range selector is used through Splunk Observability Cloud.
In charts and dashboards, it can specify a chart’s default time range. By default, Splunk Observability Cloud chooses the best time range for a chart or data view based on the characteristics of the data that it shows. However, you can use the time range selector to override the default for all charts in a dashboard.
In muting rule configuration, the time range selector indicates a time window for muting rule activation.
The time range selector supports both relative and absolute time ranges.
Specify a relative time range 🔗
You can specify a relative time range by selecting a provided time range from the menu, or by typing your preferred relative time range. To learn more, see the following sections.
Enter a relative time range 🔗
If you don’t see your desired relative time range on the menu, enter it into the time range selector field. Valid time units for time ranges are: m (minute), h (hour), d (day), and w (week).
To view data from a relative time window up to now, enter the time unit preceded by a minus ( - ) into the time range selector. For example, if you want to see a metric from the last 5 minutes, enter -5m.
To set a time range from now into the future, enter the time unit preceded by a plus ( + ) into the time range selector. For example, if you want to set a time window for the next 6 hours, enter +6h.
You can also set a relative time window up to some time before now, or from some time in the future onward.
For example, if you want to see a metric from between 1 and 3 minutes ago, select the time range selector and enter -3m to -1m.
For example, if you want to schedule a future time window for your muting rule between tomorrow and 2 days from now, select the time range selector and enter +1d to +2d.
Note
The earlier time point must come first. For example, typing -1m to -3m doesn’t work.
The time range selector shows your most recently used custom time range under the heading “Recent”.
Specify an absolute time range 🔗
To set an absolute time window with a defined start and end time, select the time range selector and select Custom. A custom time range selector appears. Select the starting and ending date and time of your desired time range, then select Apply to show data for that time range only.
Time zone abbreviations are based on the user’s browser locale for both the time stamp and time range selections. If you are sharing time stamps with team members across locales, take care to avoid confusion over time zone abbreviations, which might have ambiguous meanings depending on the language. For example, CST is UTC -6:00 in US English, while it is UTC +9:30 in Australian English. Using ISO with UTC offsets is the preferred method. Preferred absolute time formats include:
18 Sep 10:18 to 19 Sep 10:18
If the same date: 10:18 to 10:20
If you copied an ISO range, 2023-10-15T04:19:00.000-07:00 to 2023-10-16T16:19:00.000-07:00
Select a custom time range 🔗
You can also view data from a relative or absolute time window with a defined start and end time. Select the time range selector and select Custom from the menu. A custom time range selector appears. Select the starting and ending date and time of your desired time range, then select Apply.
Pan through time ranges 🔗
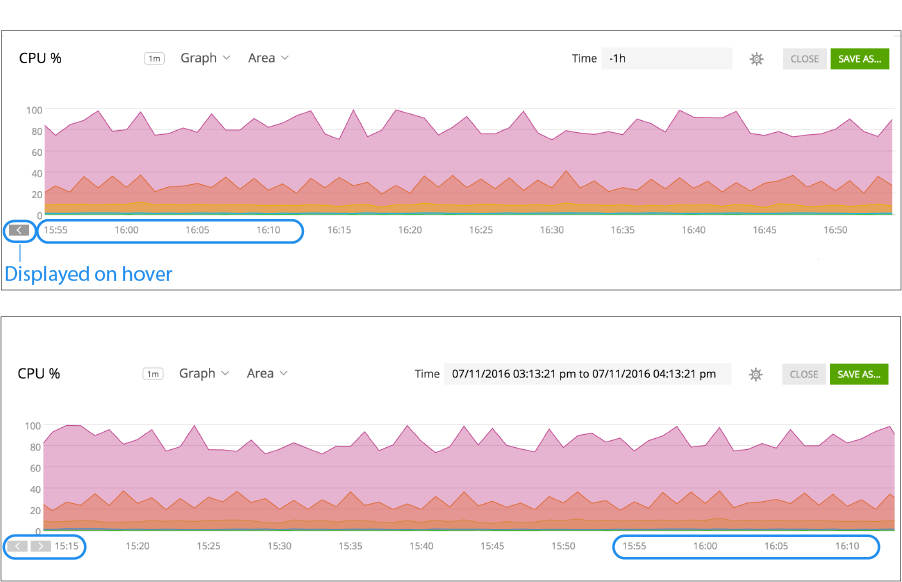
When you look at a chart on a dashboard or in the Chart Builder, you can hover over the lower left corner to display panning controls. Initially, you can only see the control for panning back in time. Once you pan back in time, you can see controls for panning back and forward.
Selecting one of these controls changes the time range to an absolute time range, changing by 2/3 of an increment each time you select the control; for example, if you pan backwards, the last third of the panned chart overlaps the first third of the original chart.
In the following illustration, the current time is approximately 4:55 PM (16:55) and the chart is displaying data for the last 1 hour, starting at 15:55. Panning back once displays a time range starting at approximately 15:15, 40 minutes prior to 15:55.