Monitor Database Query Performance 🔗
Slow database queries might be the culprit of wider service availability issues. With Database Query Performance, you can monitor the impact of your database queries on service availability directly in Splunk APM. This way, you can quickly identify long-running, unoptimized, or heavy queries and mitigate issues they might be causing, without having to instrument your databases.
Splunk APM identifies databases as inferred services in your system using automatically generated span tags. Databases appear throughout APM, such as in their inferred locations in the service map, in the service filter list, and in trace view. See Analyze the performance of inferred services to learn more about inferred services in APM.
With Database Query Performance, Splunk APM provides additional analytics for a set of supported SQL and NoSQL databases. See Supported databases for the full list.
To provide analytics for database queries, Splunk APM captures SQL statements, or queries, from the span in which each call happens. Then APM replaces dynamic elements in each raw query with static placeholders to minimize cardinality, and records the following metrics about the query’s performance:
Total response time
90th percentile (P90) of latency
Total number of requests
Requests per second
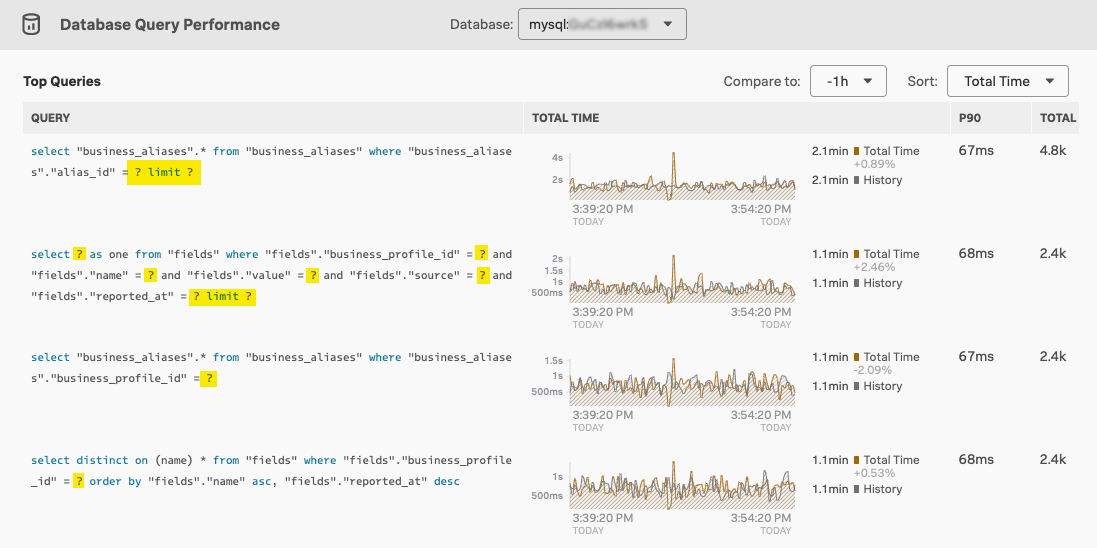
Normalized queries have all dynamic elements replaced by the ? character. The following screenshot shows database queries in Database Query Performance with replaced dynamic elements:

Note
To learn more about the handling of personal identifiable information for database monitoring, see Remove sensitive information from database queries.
Although Database Query Performance doesn’t replace end-to-end database monitoring tools targeted at database administrators (DBAs), it can help you quickly determine whether a service availability issue is related to a particular database query, so you can alert the correct admin.
You can use insights from Database Query Performance to address the following scenarios related to monitoring service availability, optimizing service performance, and monitoring database queries themselves:
You can use Database Query Performance to address the following scenarios related to service availability:
Isolate database issues: Determine whether an increase in the latency or error rate of a service is related to problems with a database. If it is, you can quickly identify which database and which specific query is contributing the most latency, so you can resolve it by involving the DBA or the owner of the service that’s making the slow database call.
Identify underlying infrastructure: Thanks to Related Content, see which host is running the database service, or get to the database service from Infrastructure Monitoring. For more information, see Related Content in Splunk Observability Cloud.
Respond to alerts: When you receive alerts about service availability, you can quickly eliminate databases as a root cause of the issue by seeing at a glance whether database latency or error rate increased, or whether a particular query is slow or bottlenecked.
Dashboard with databases: Use a dashboard to determine whether a new release to a service had an impact on database interactions by examining the average query response time, the number of query executions, and the change in these values over time.
Assess impact: When you receive an alert related to database latency, quickly assess the radius of impact to determine whether customer-facing services were impacted.
You can also use Database Query Performance to identify possible opportunities to optimize your system.
Compare queries within a given database: By viewing query performance for a specific database over time, you can use the list of queries to identify the top database queries by latency or execution count and find opportunities to improve the performance of a given database.
Examine a specific query over time: You can also examine the performance of a specific query over time. This lets you see whether other factors in your system have affected the latency or request frequency of a given query within a database to help you decide whether you need to adjust or optimize that query.
Database Query Performance is available by default, so all you need to do is turn on the feature so that APM automatically begins indexing database-related span tags. See Turn on Database Query Performance to get started monitoring database performance in APM.
Monitor system health with Database Infrastructure Performance 🔗
If, as a site reliability engineer, apparent slowness in microservices has you wondering whether to investigate your infrastructure further, you can use Database Infrastructure Performance for help with triage of the following conditions:
Lock contention
Limited I/O (throughput)
Transient effects (spikes or constant loads)
The Database Infrastructure Performance panel displays at the bottom of the navigator sidebar when from APM in Splunk Observability, you use Database Query Performance to select a MySQL, SQL Server, or Oracle database service. You can also access the Database Infrastructure Performance panel through the Service Map module in the APM menu.
The performance metrics display is enabled by related content correlation of databases that happens when the OpenTelemetry (OTel) Collector is connected to a database. For more information, see Related Content in Splunk Observability Cloud. Expand the Database Infrastructue Performance panel to see the relevant Infrastructure Navigator view. You can use this panel to review key metrics without leaving Splunk APM.
See the following links for more information about Database Query Performance:
To turn on Database Query Performance, see Turn on Database Query Performance.
For a scenario focusing on MySQL and SQL troubleshooting, see Scenario: Jax identifies slow database queries using Database Query Performance.
For a scenario focusing on Redis and NoSQL troubleshooting, see Scenario: Skyler investigates Redis performance issues using Database Query Performance.
To troubleshoot issues with Database Query Performance, see Troubleshoot Database Query Performance.
For reference material about Database Query Performance, see Reference for Database Query Performance.
