Scenario: Skyler investigates Redis performance issues using Database Query Performance 🔗
Skyler, the lead site reliability engineer at Buttercup Games, has to troubleshoot high latencies reported by customers in the new advertisement service, which uses a Redis database.
Check the Redis infrastructure 🔗
Skyler starts by checking the Redis infrastructure in Splunk Infrastructure Monitoring. They notice that the commands processing rate has drastically dropped, and that the total number of commands processed by the server diminished.
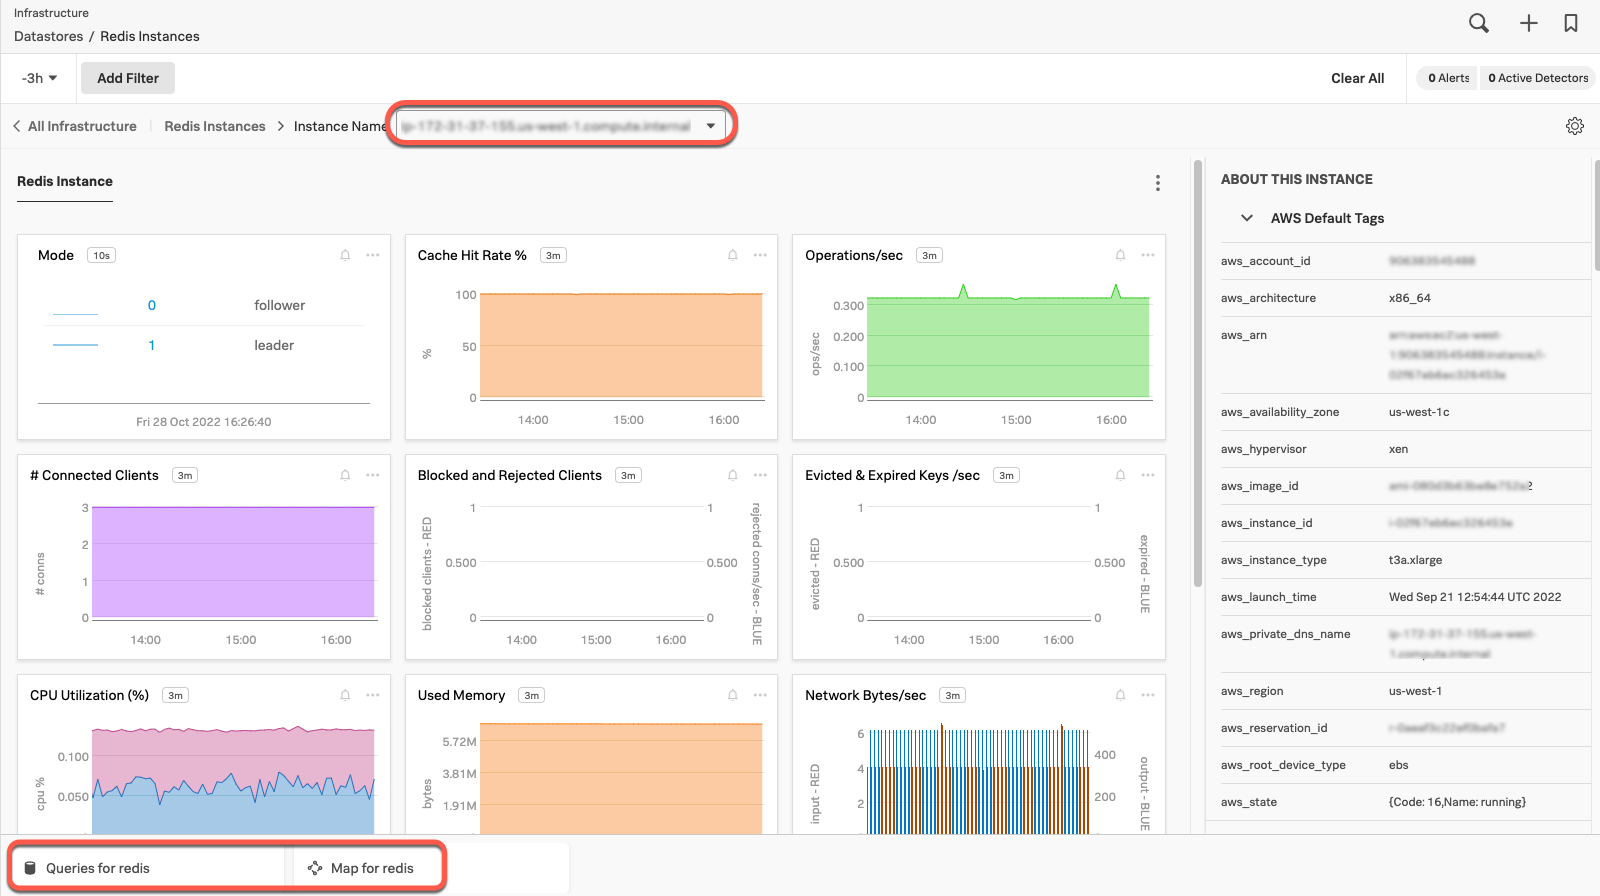
This might mean that one or more commands are causing the latency issues. To further investigate this, Skyler selects the Related Content tile at the bottom of the screen to jump to Splunk APM.
Jump to the service in Splunk APM 🔗
The service map of Splunk APM appears. Skyler immediately selects the Redis database and see at a glance which commands are the slowest. The latency and request and errors charts provide a view of the performance trend.
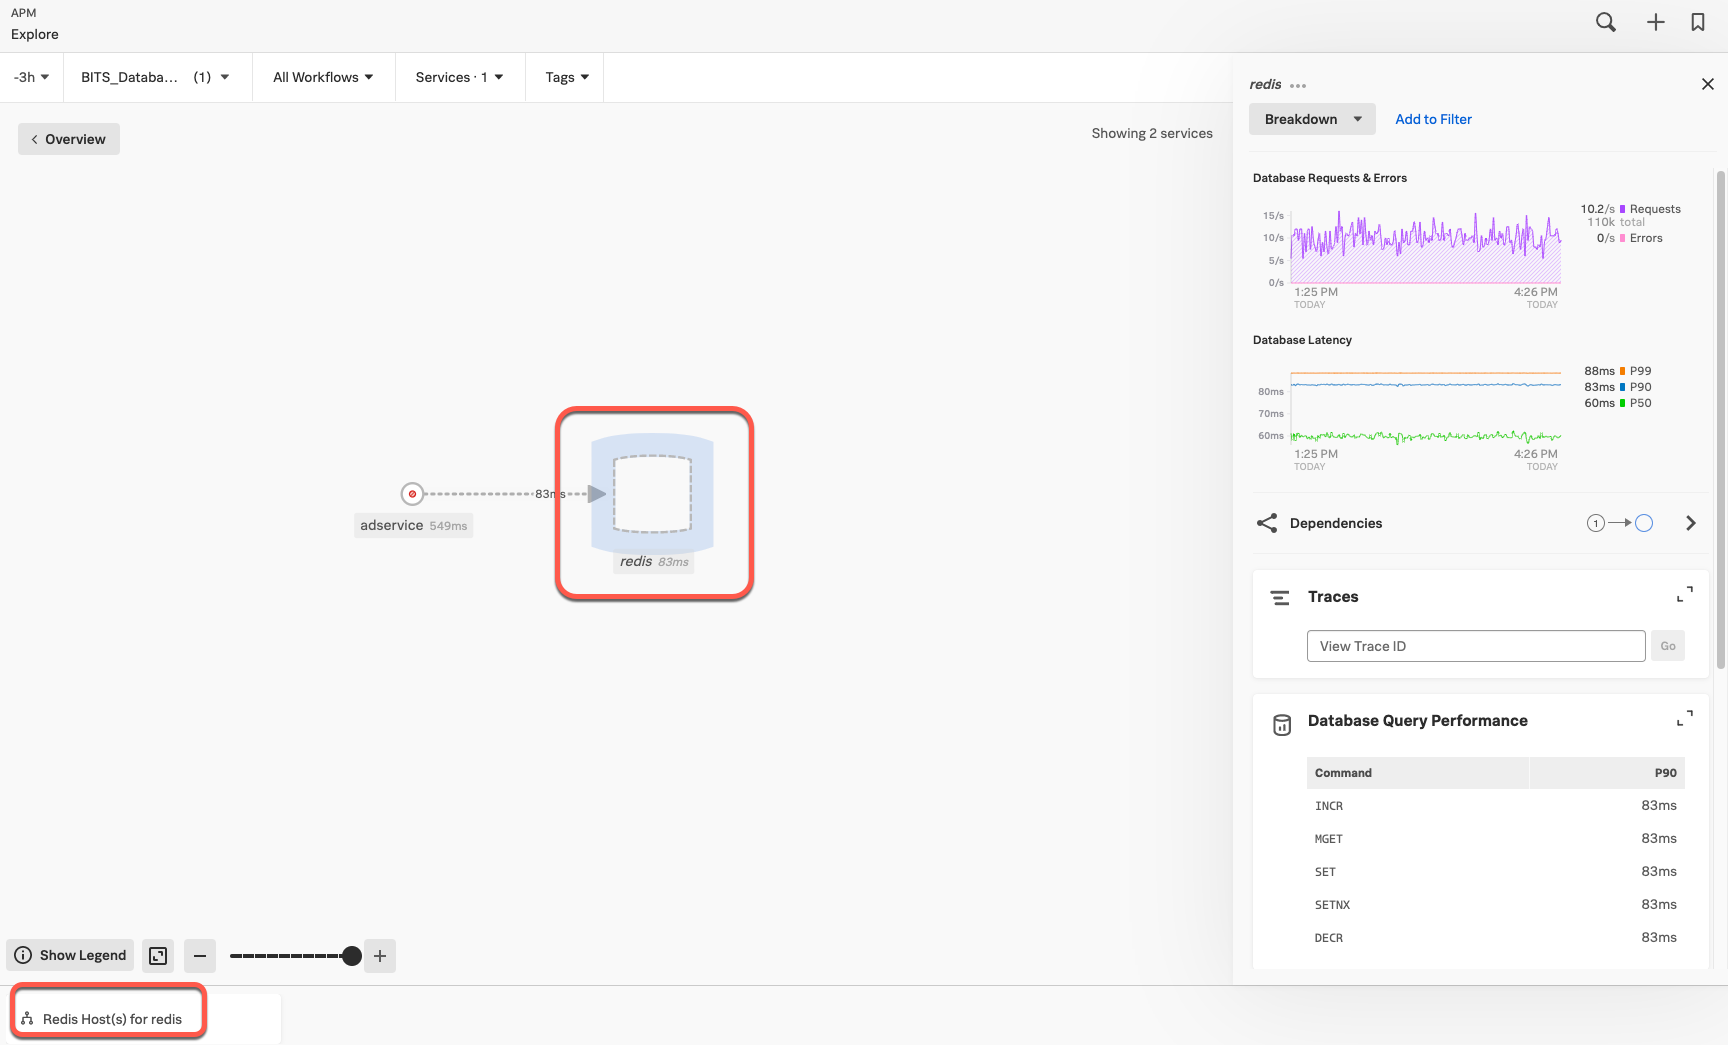
Skyler selects Database Query Performance to get to the root of the issue.
Examine the latency of Redis commands 🔗
After opening Database Query Performance from the service map, Skyler sees the list of Redis commands, sorted by total time. For each command, they can see the requests and latency, as well as tag spotlight data.
Skyler knows that commands operating on many elements, like SORT, LREM, and SUNION can be slow. They identify a command with a problematic latency, and selects the latency chart to load example traces.
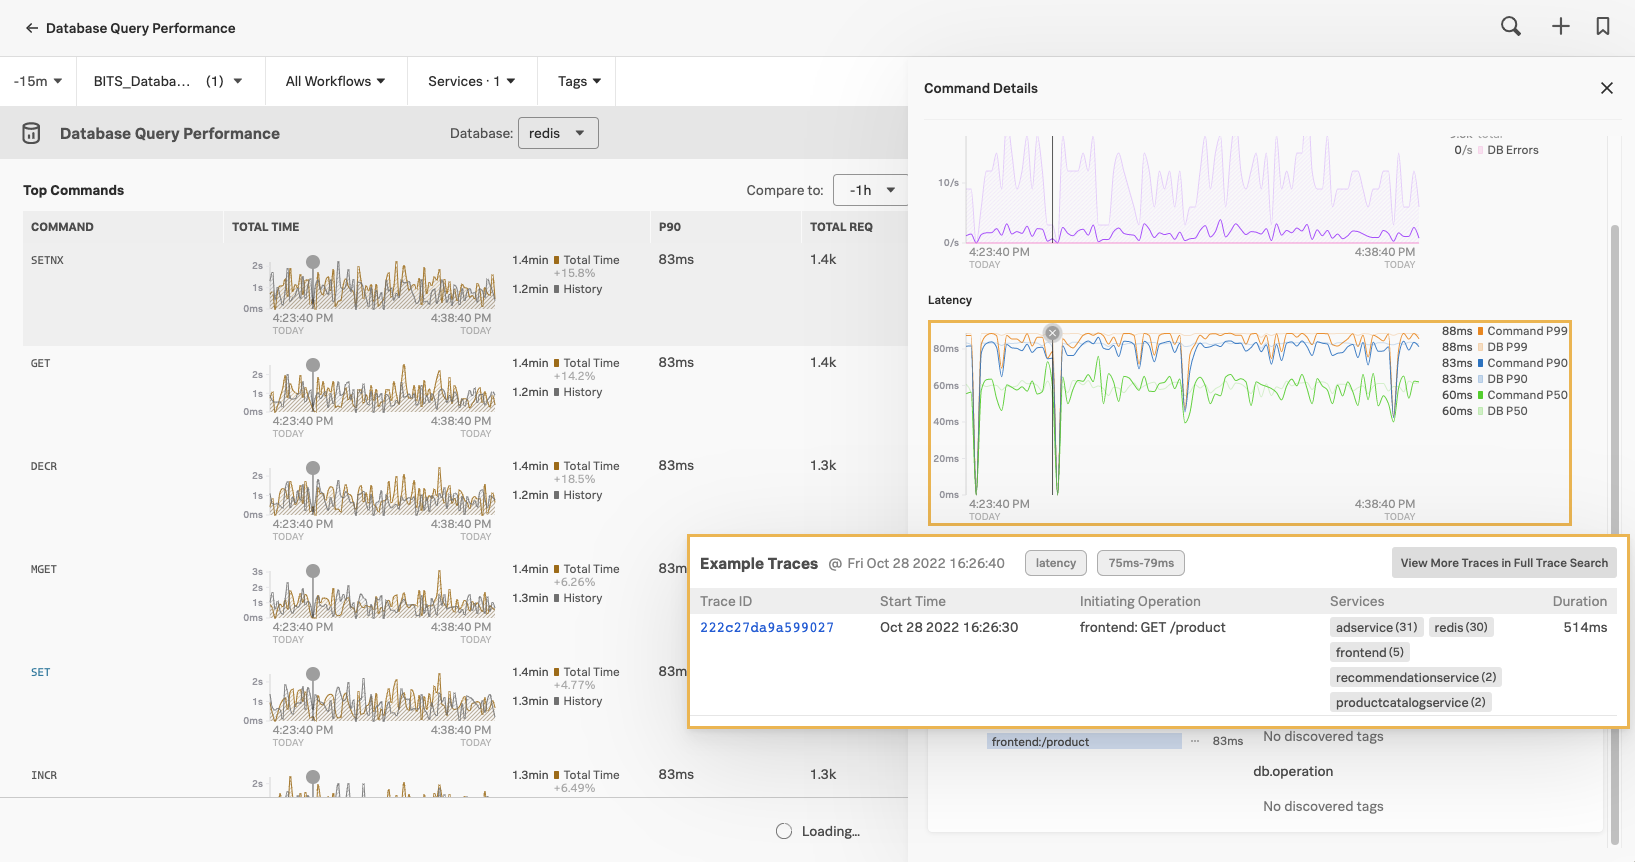
Skyler selects the example trace to find out more about the latency of that particular span.
Dig into spans and related commands 🔗
From the trace view, Skyler selects the Redis span and verifies which database statements compose the command. The performance summary points at the database spans being the main source of overhead.

With information from this and other traces, Skyler has enough information to optimize the Redis commands, which results in a noticeable performance improvement.
Learn more 🔗
See the following links for more information about Database Query Performance:
For an overview of Database Query Performance, see Monitor Database Query Performance.
To turn on Database Query Performance, see Turn on Database Query Performance.
To learn more about Related Content, see Related Content in Splunk Observability Cloud.
To troubleshoot issues with Database Query Performance, see Troubleshoot Database Query Performance.
For reference material about Database Query Performance, see Reference for Database Query Performance.