Scenario: Deepu finds the root cause of an error using Tag Spotlight 🔗
Deepu receives a notification from Kai, the site reliability engineer. The notification says that the high root-cause error rate with the /PaymentService/Charge endpoint is preventing customers from shopping on the Buttercup Games website. The notification also includes a link to the endpoint on the Splunk APM service map.
To troubleshoot the issue, Deepu takes the following steps:
Deepu reviews Tag Spotlight for tags that are correlated with errors
Deepu switches to Splunk Log Observer for further troubleshooting
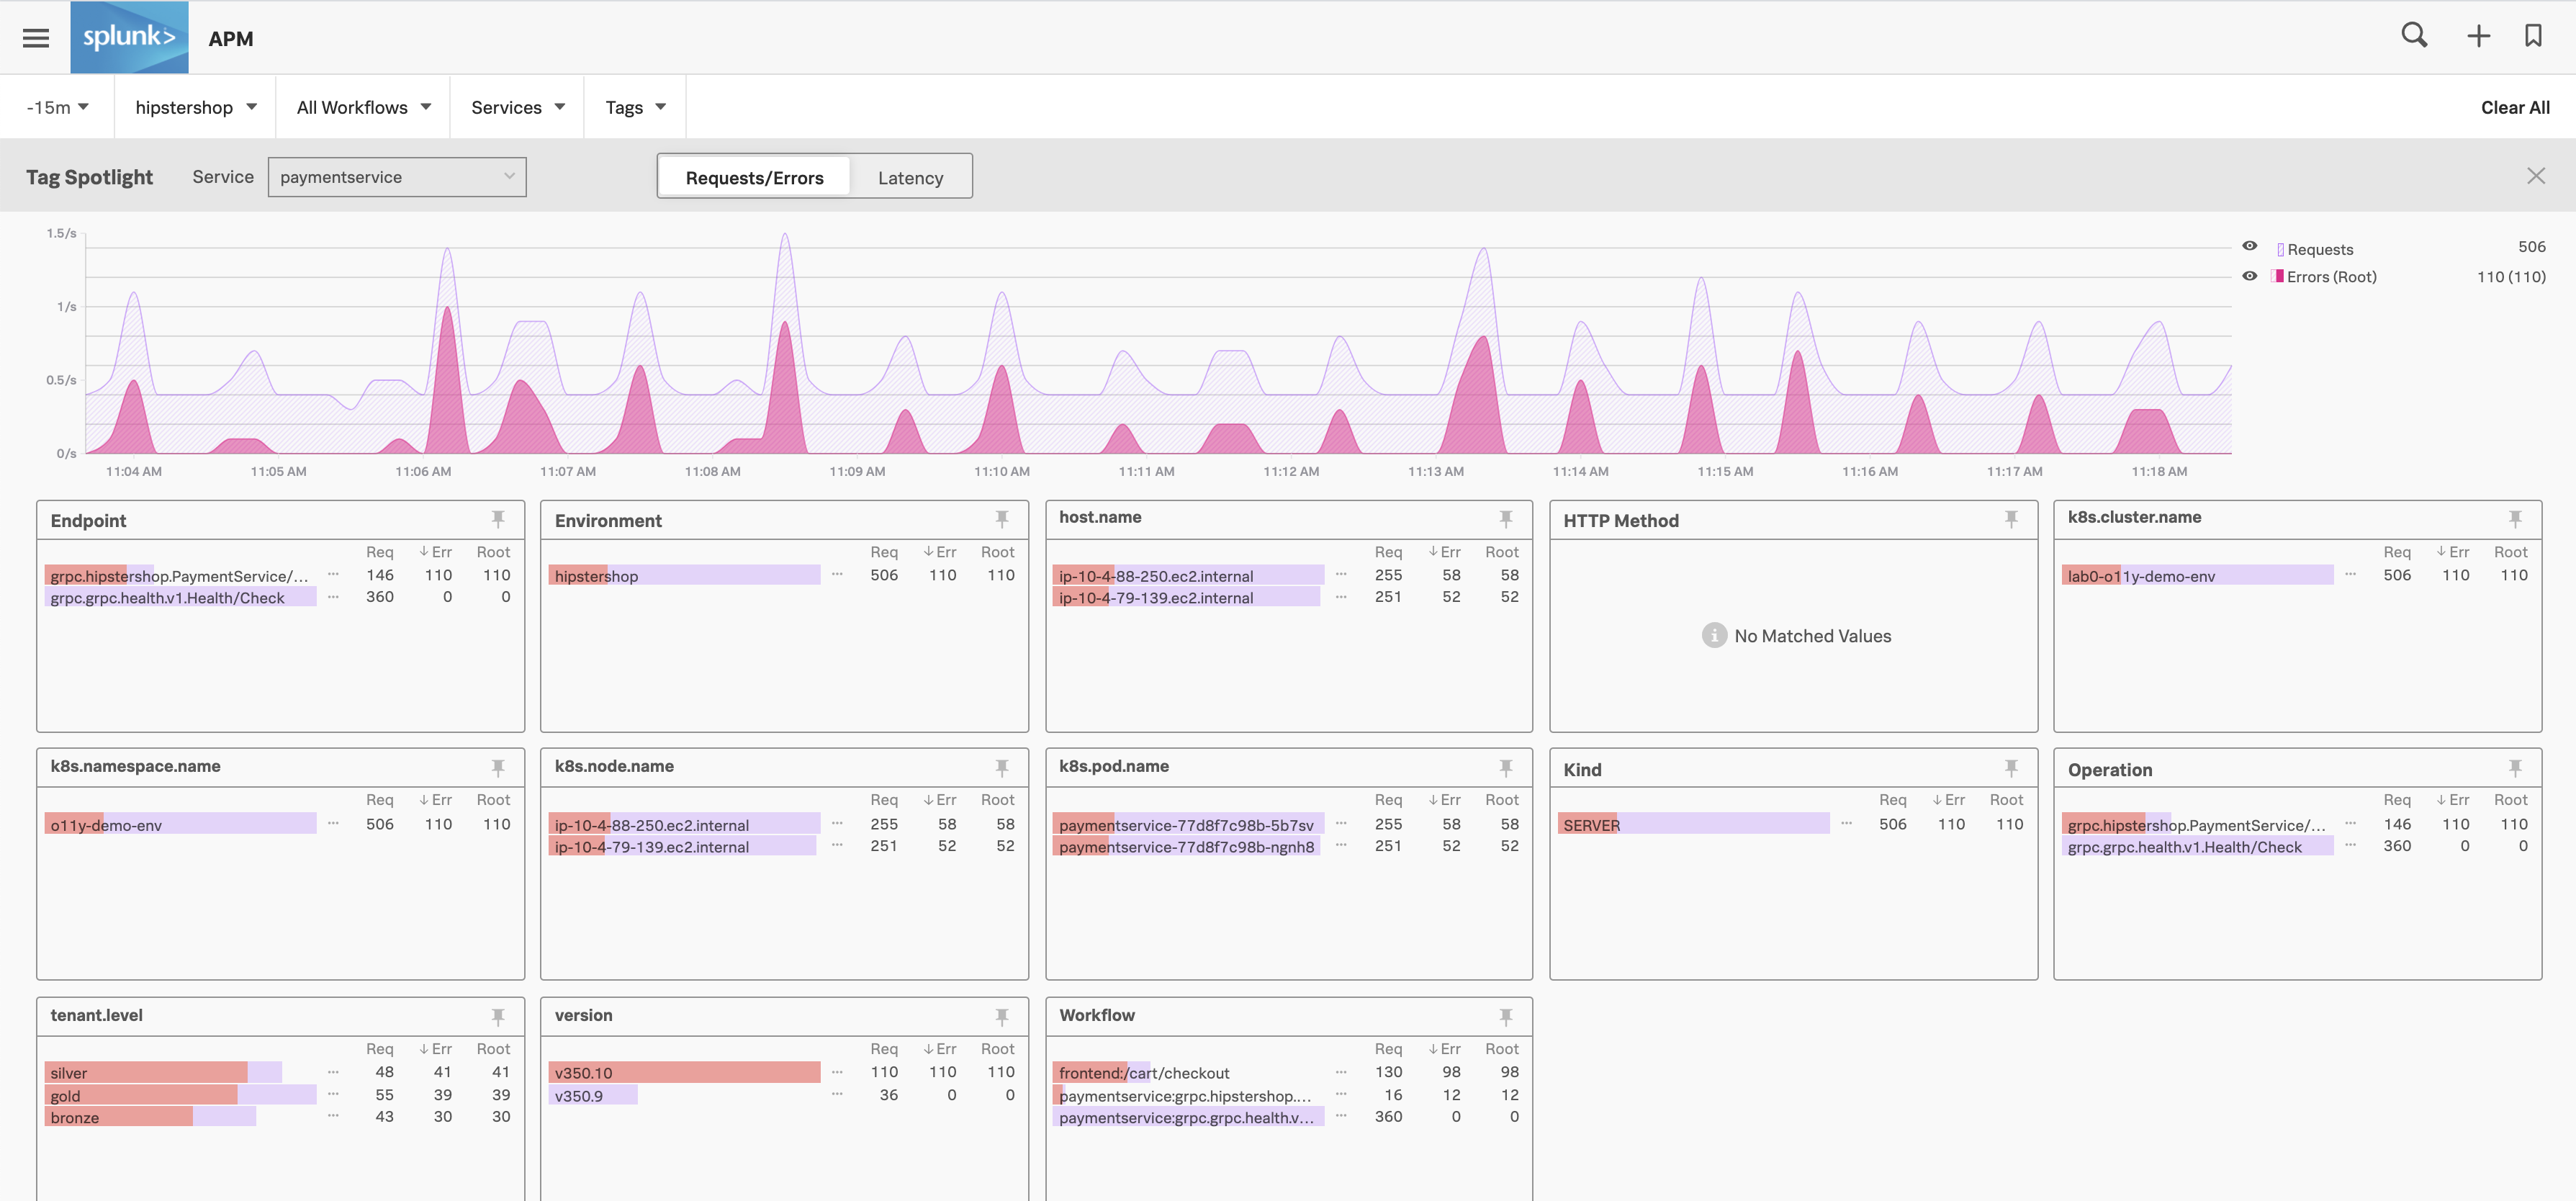
Deepu opens Tag Spotlight and selects the affected service 🔗
Deepu uses search to search for Tag Spotlight and selects the navigation result to go to Tag Spotlight. They select the paymentservice.
Deepu reviews Tag Spotlight for tags that are correlated with errors 🔗
Deepu scans through the requests and errors correlated with each indexed tag in the payment service.
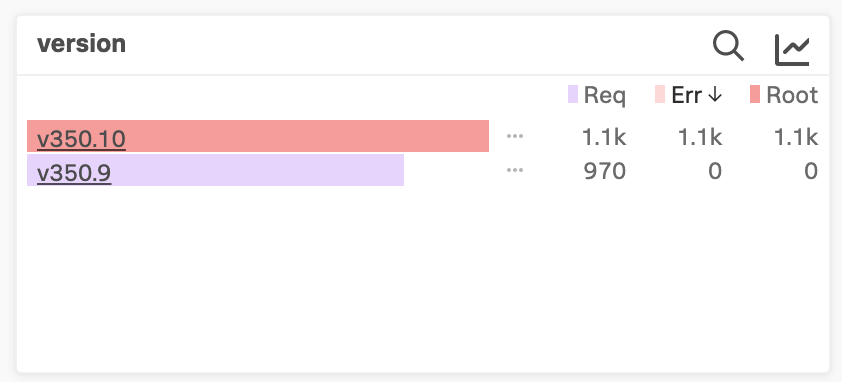
Deepu notices errors differ based on the version tag 🔗
Deepu sees that the errors are evenly distributed for all tag values except the version tag. All errors occur in version 350.10, a recent code release for the service. Deepu rolls back to the previous release, version 350.9, to keep the site running while notifying and waiting for the engineers to solve the issue.
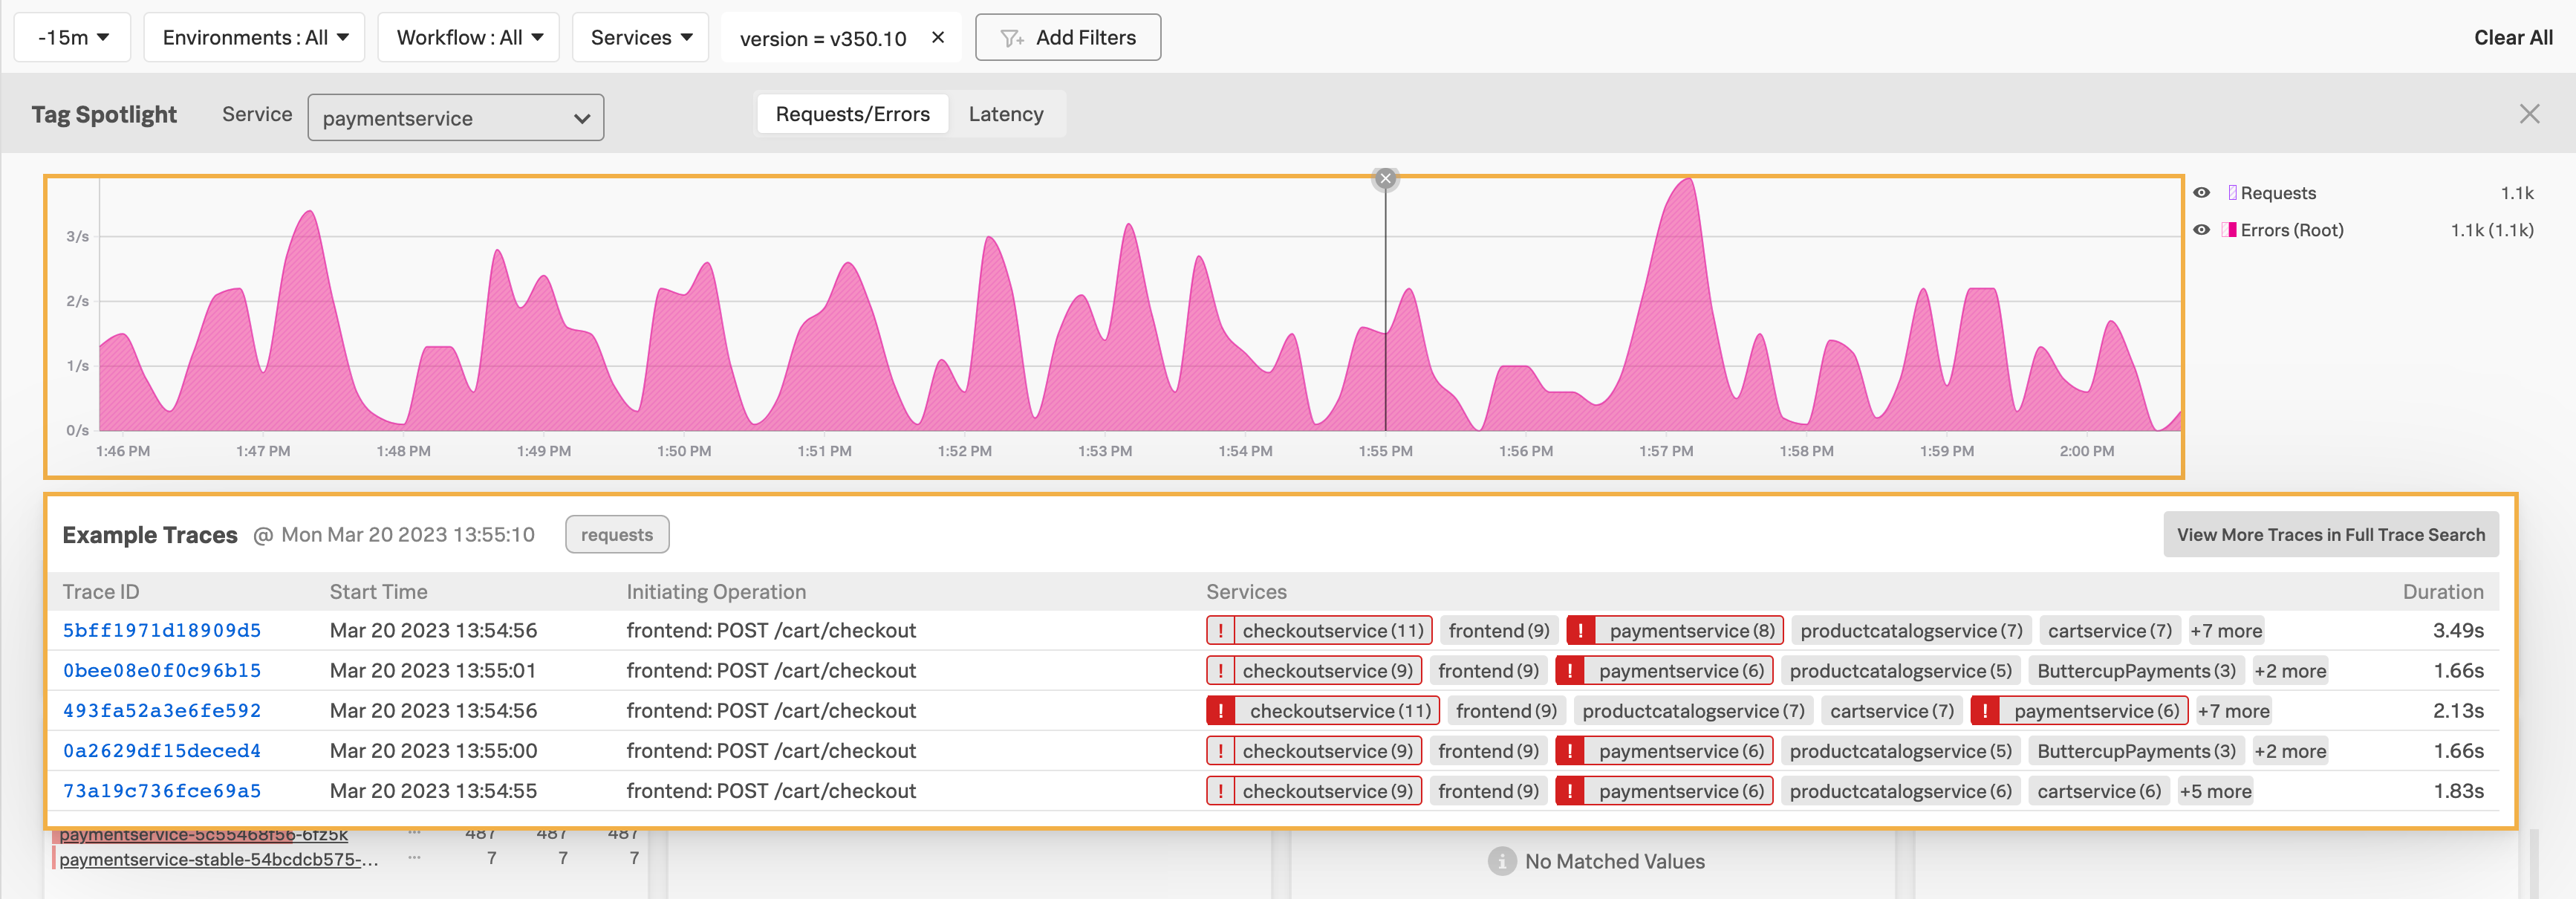
Deepu opens an example trace 🔗
Deepu narrows the investigation to the code in version 350.10 of the /PaymentService/Charge endpoint and selects the Request/Errors chart to get an example trace to see what the error is.
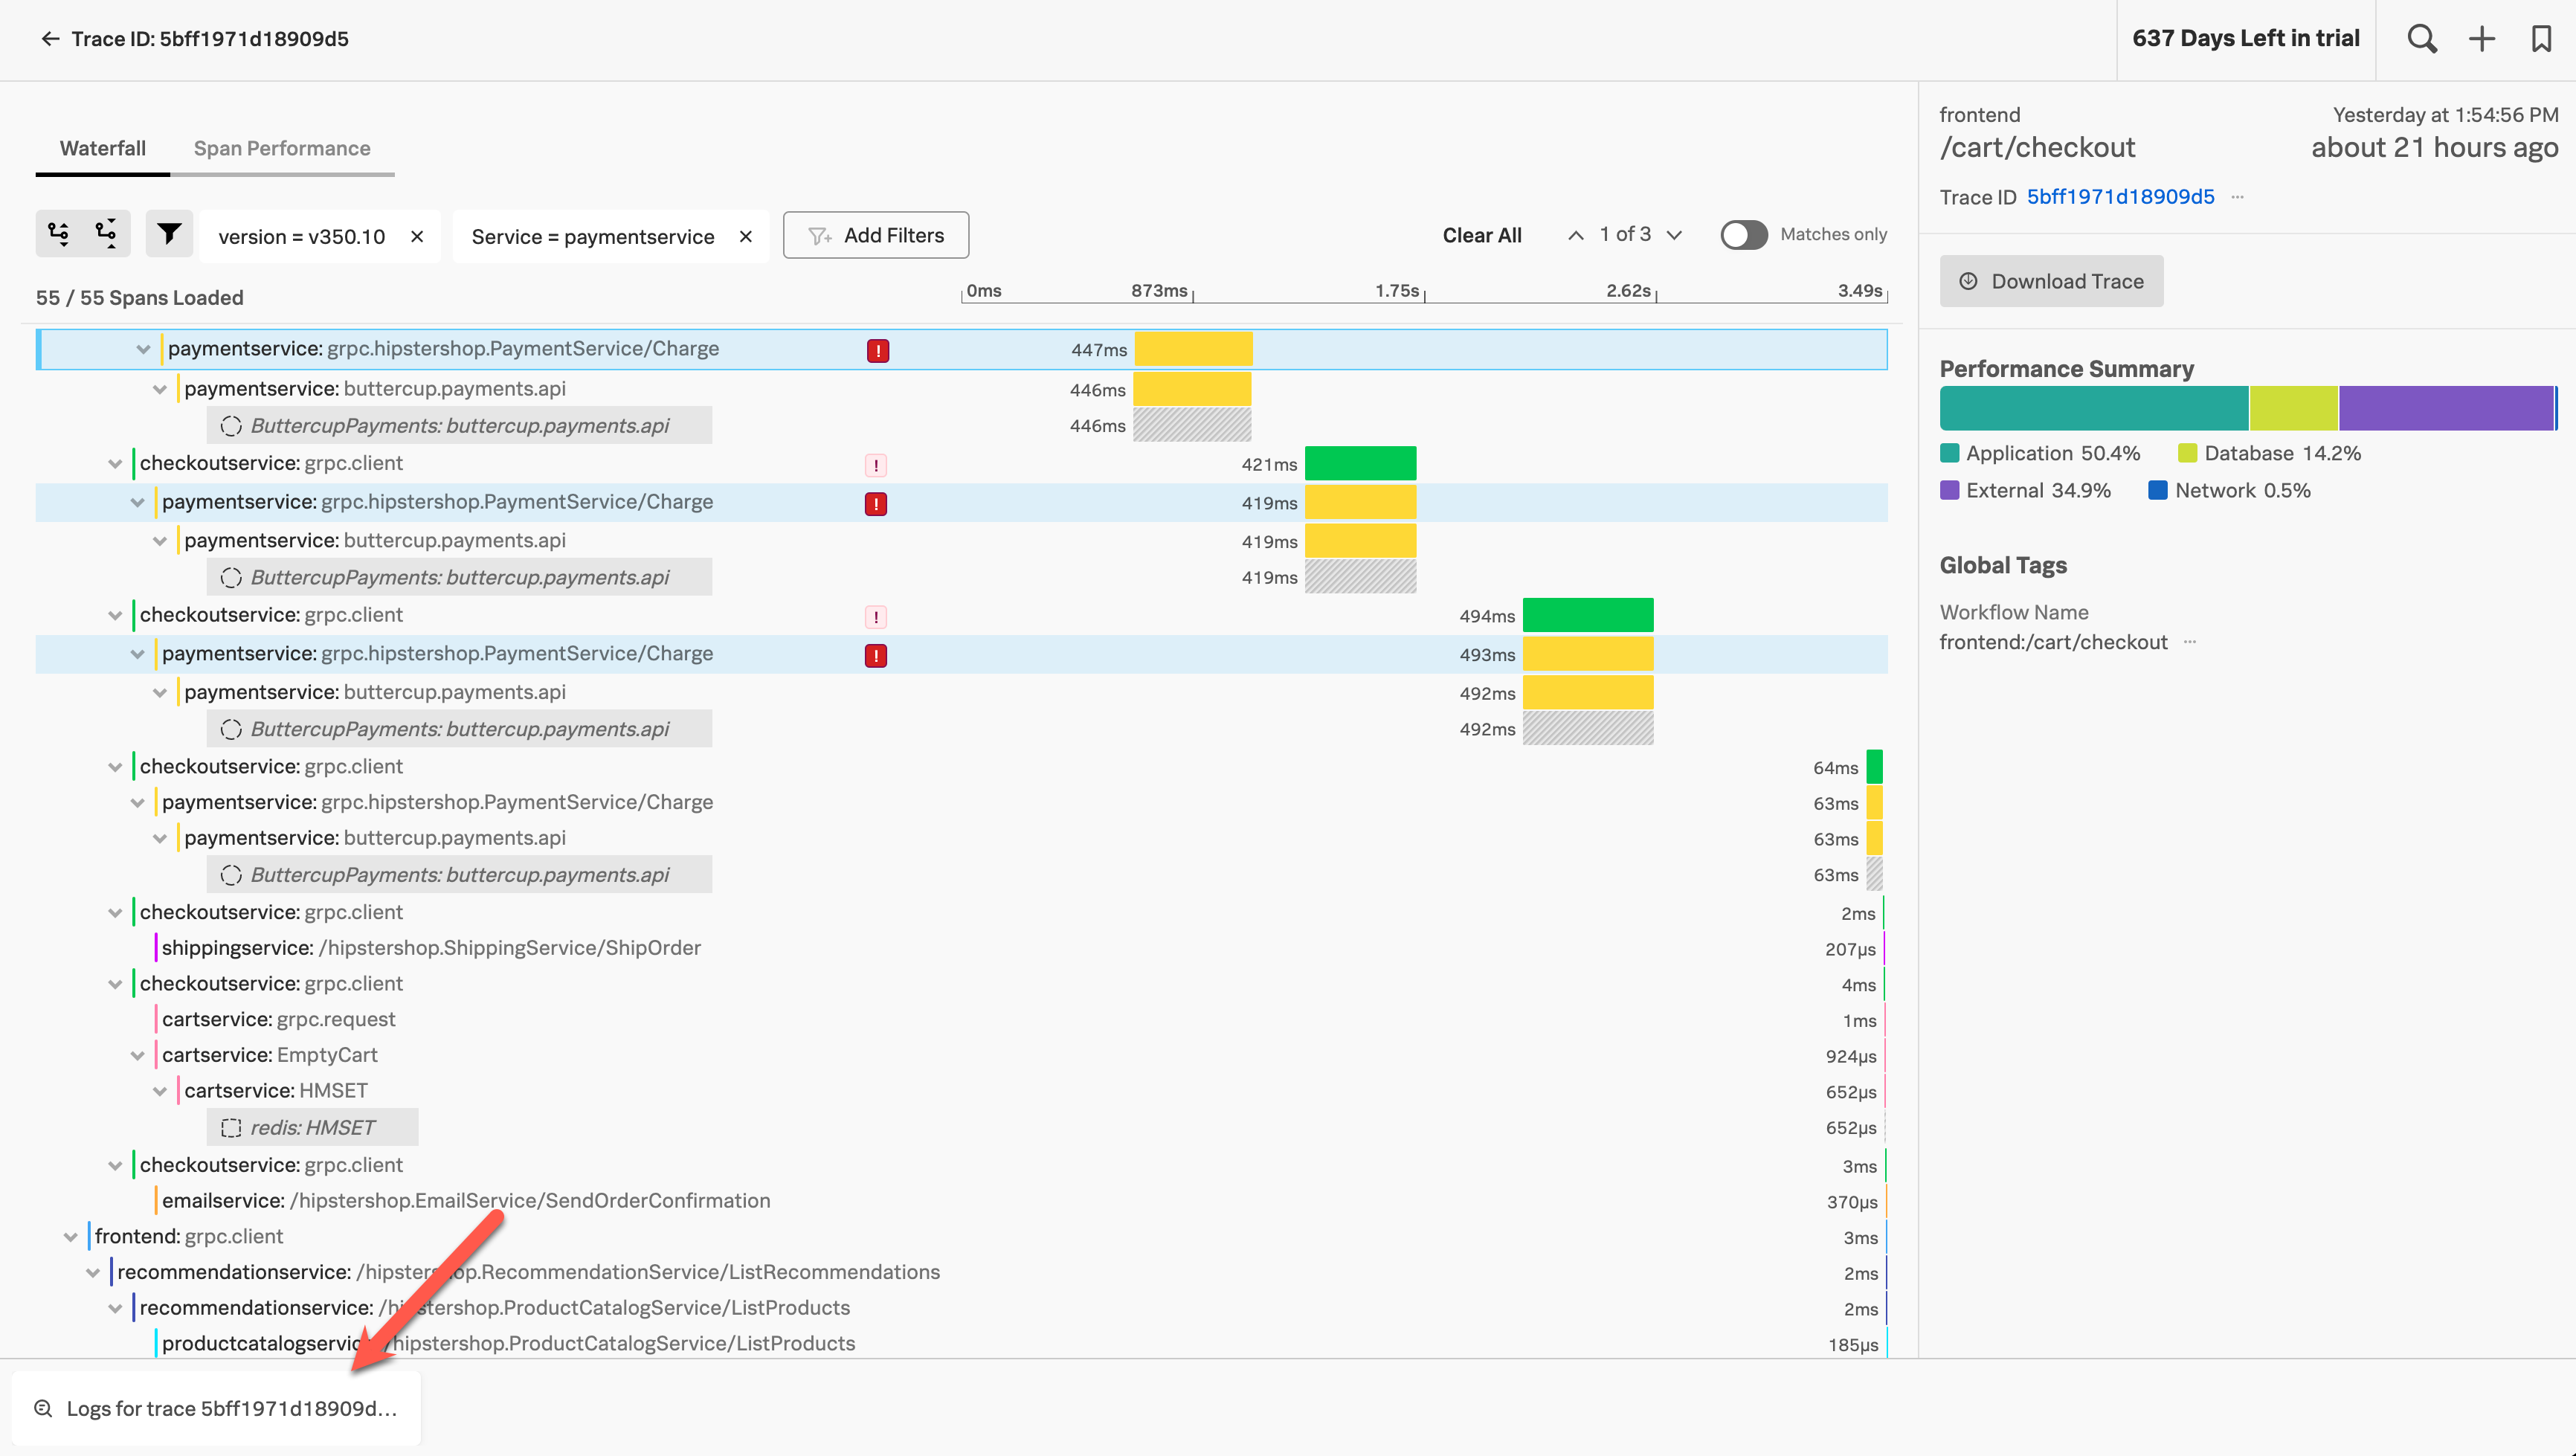
Deepu switches to Splunk Log Observer for further troubleshooting 🔗
Because Deepu turned on Related Content in Splunk APM, Deepu can select Logs for trace to switch to Splunk Log Observer for further troubleshooting.
Summary 🔗
Deepu used Tag Spotlight to quickly isolate a recent code release as the cause of errors that prevented customers from shopping on the Buttercup Games website. Using the links to example traces in Tag Spotlight, they quickly navigate to an example trace and its corresponding logs to further troubleshoot.
Learn more 🔗
For details about Tag Spotlight, see Analyze service performance with Tag Spotlight.
For details about using Related Content, see Related Content in Splunk Observability Cloud.
For more information about using Splunk Log Observer Connect to detect the source of problems, see Introduction to Splunk Log Observer Connect.