Scenario: Alex troubleshoots an issue to find the root cause using Trace Analyzer 🔗
Alex, the site reliability engineer for Buttercup Games, receives a report of a customer who received an error during checkout. To proactively prevent a potential incident, Alex uses Trace Analyzer to quickly determine how pervasive the checkout errors are.
These are the steps Alex takes to determine how pervasive the checkout errors are:
Alex reviews the customer’s trace for errors 🔗
Customer support shares a trace ID which Alex uses to pull up the trace to begin troubleshooting. Alex notes that an http request in the checkout service is returning a 500 error. Alex wants to quickly understand how prevalent this error is for the checkout flow. So, Alex makes a note of the http.url for the request that is returning a 500 to investigate further.
Alex groups traces by specific tags 🔗
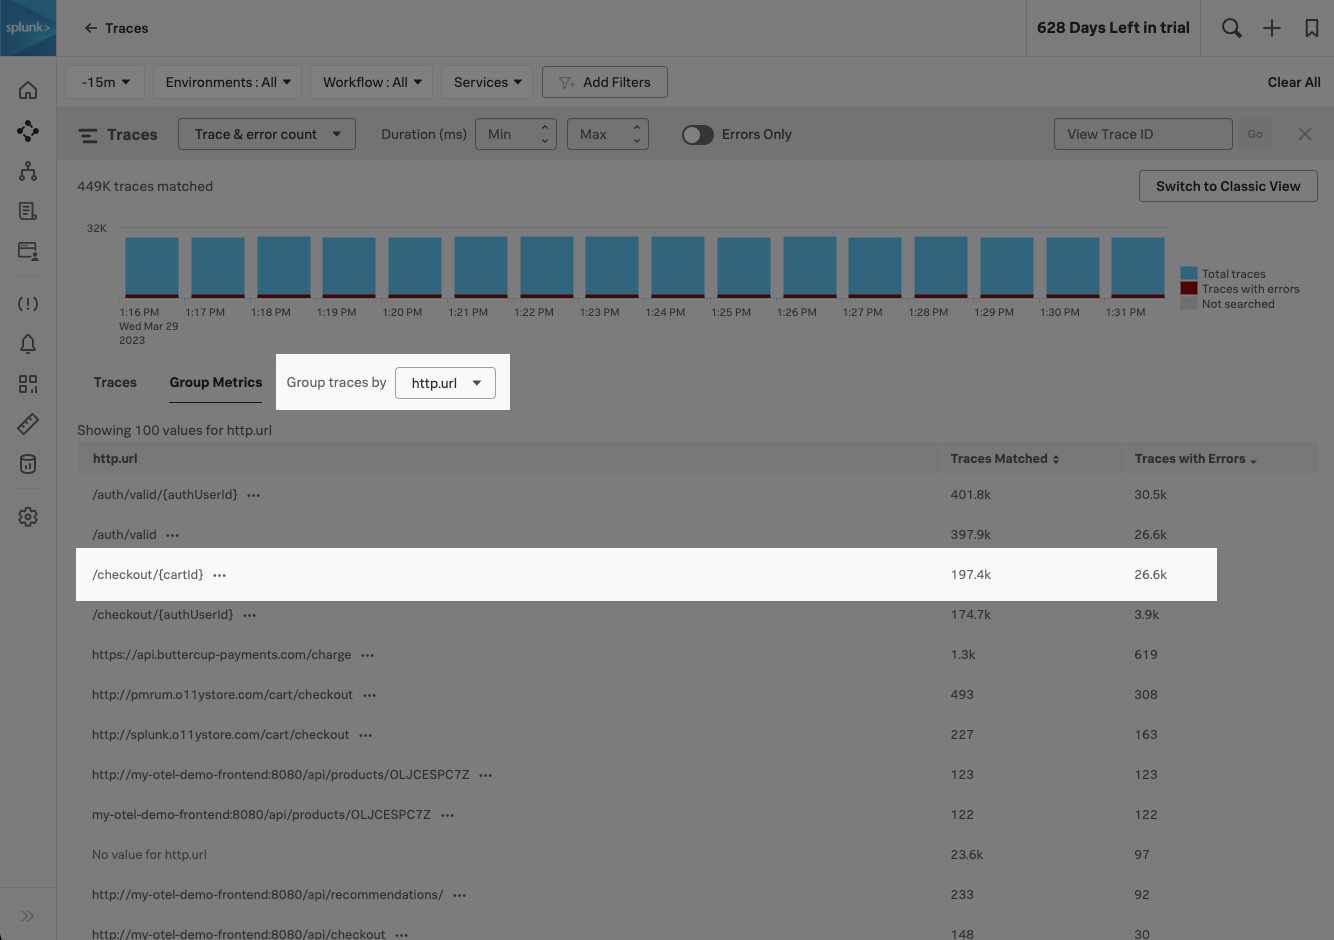
Because http.url is an unindexed span, Alex can’t use Tag Spotlight to see a breakdown in requests and errors by http.url. So, Alex goes to Trace Analyzer and selects http.url in the Group traces by menu to quickly understand the prevalence of errors for the specific http.url value that they made note of from the problematic trace. Alex notes that over 10% of traces for the /checkout/{cardId} request have errors.
Alex filters Trace Analyzer by a specific tag 🔗
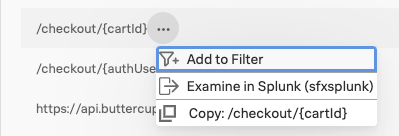
Alex adds the /checkout/{cardId} http url to the Trace Analyzer filter so that he can review traces for this specific endpoint.
Alex compares successful traces to traces with errors 🔗
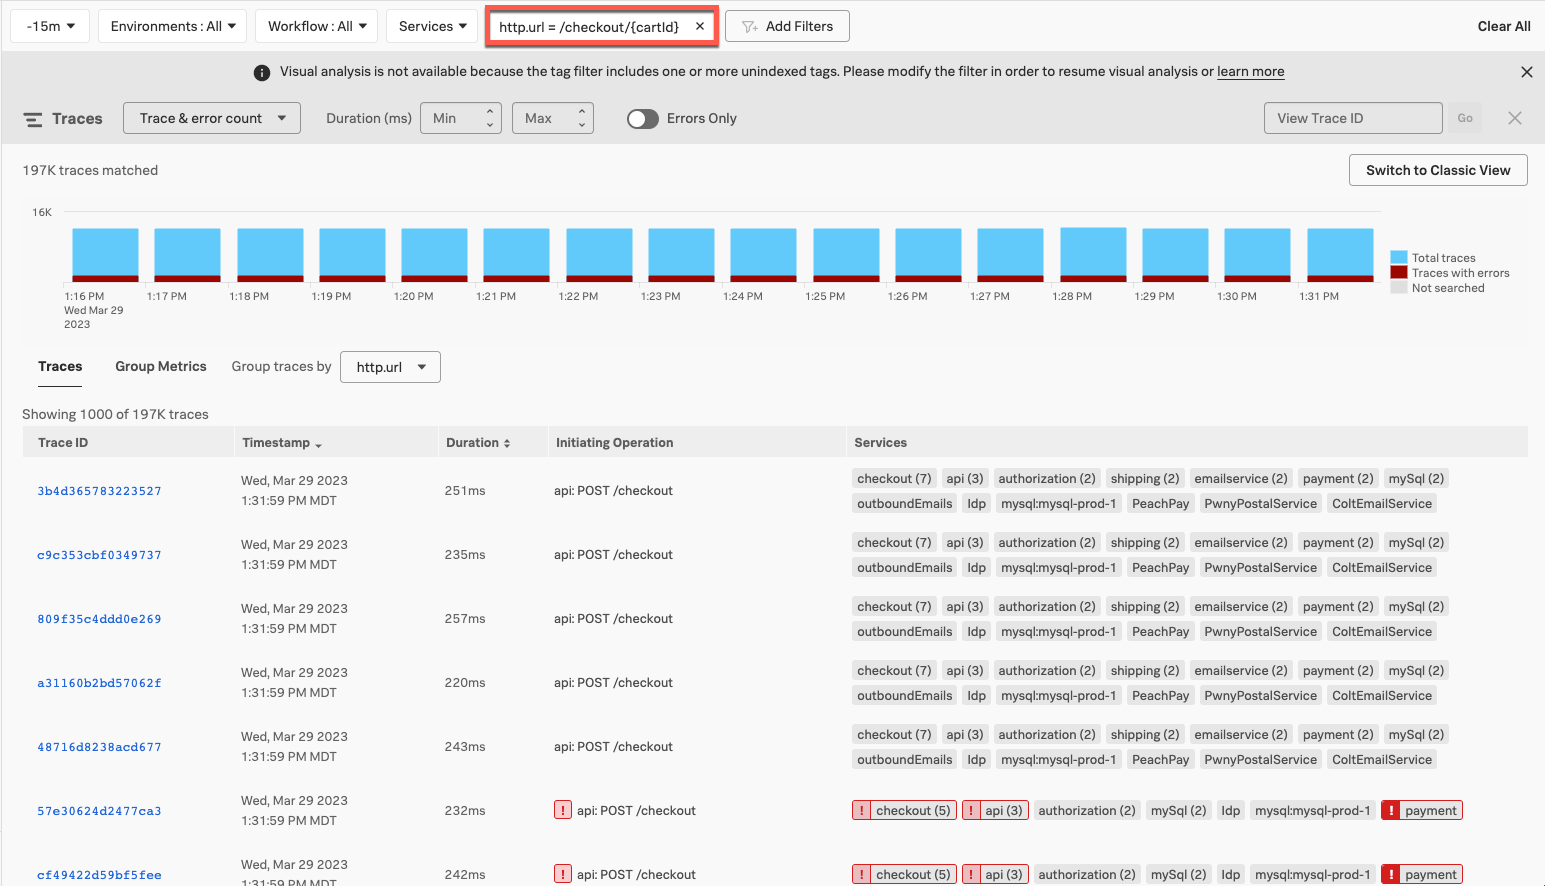
Now, Alex can review and compare successful traces for the /checkout/{cardId} http url with traces for the same endpoint that have errors.
Summary 🔗
Using the high-resolution data provided by full-fidelity tracing, Alex managed to quickly determine the prevalence of an unknown issue. Using the grouping and filtering functionality of Trace Analyzer, Alex quickly isolated successful and problematic traces to provide to the engineers to isolate the issue.
Learn more 🔗
For more information on Trace Analyzer, see Explore your traces using Trace Analyzer in Splunk APM.
For another Trace Analyzer scenario, see Scenario: Alex troubleshoots slow traces using Trace Analyzer.
For a list of APM key concepts, see Key concepts in Splunk APM.
For more Splunk APM scenarios, see Scenarios for troubleshooting errors and monitoring application performance using Splunk APM.