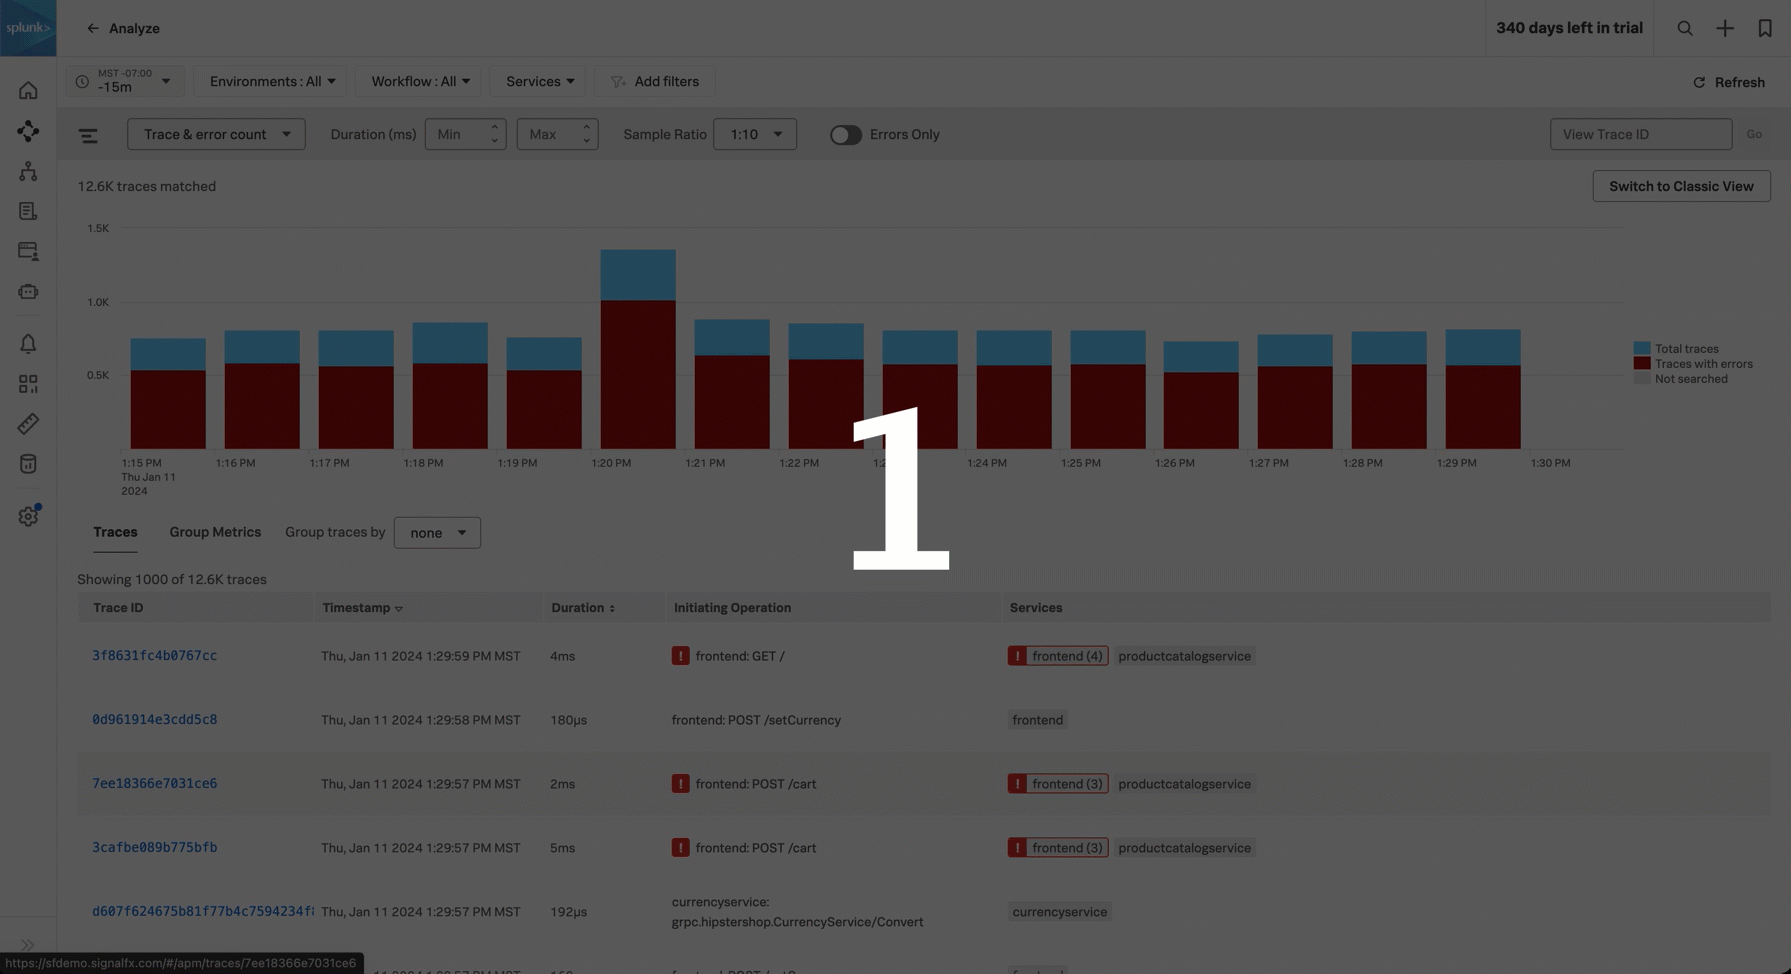
Scenario: Alex troubleshoots slow traces using Trace Analyzer 🔗
Alex, the site reliability engineer for Buttercup Games, receives a report of a few customers who experienced slowness using Buttercup Games. To proactively improve the customer experience, Alex uses Trace Analyzer to determine how pervasive the slowness is.
These are the steps Alex takes to determine how pervasive the slowness is:
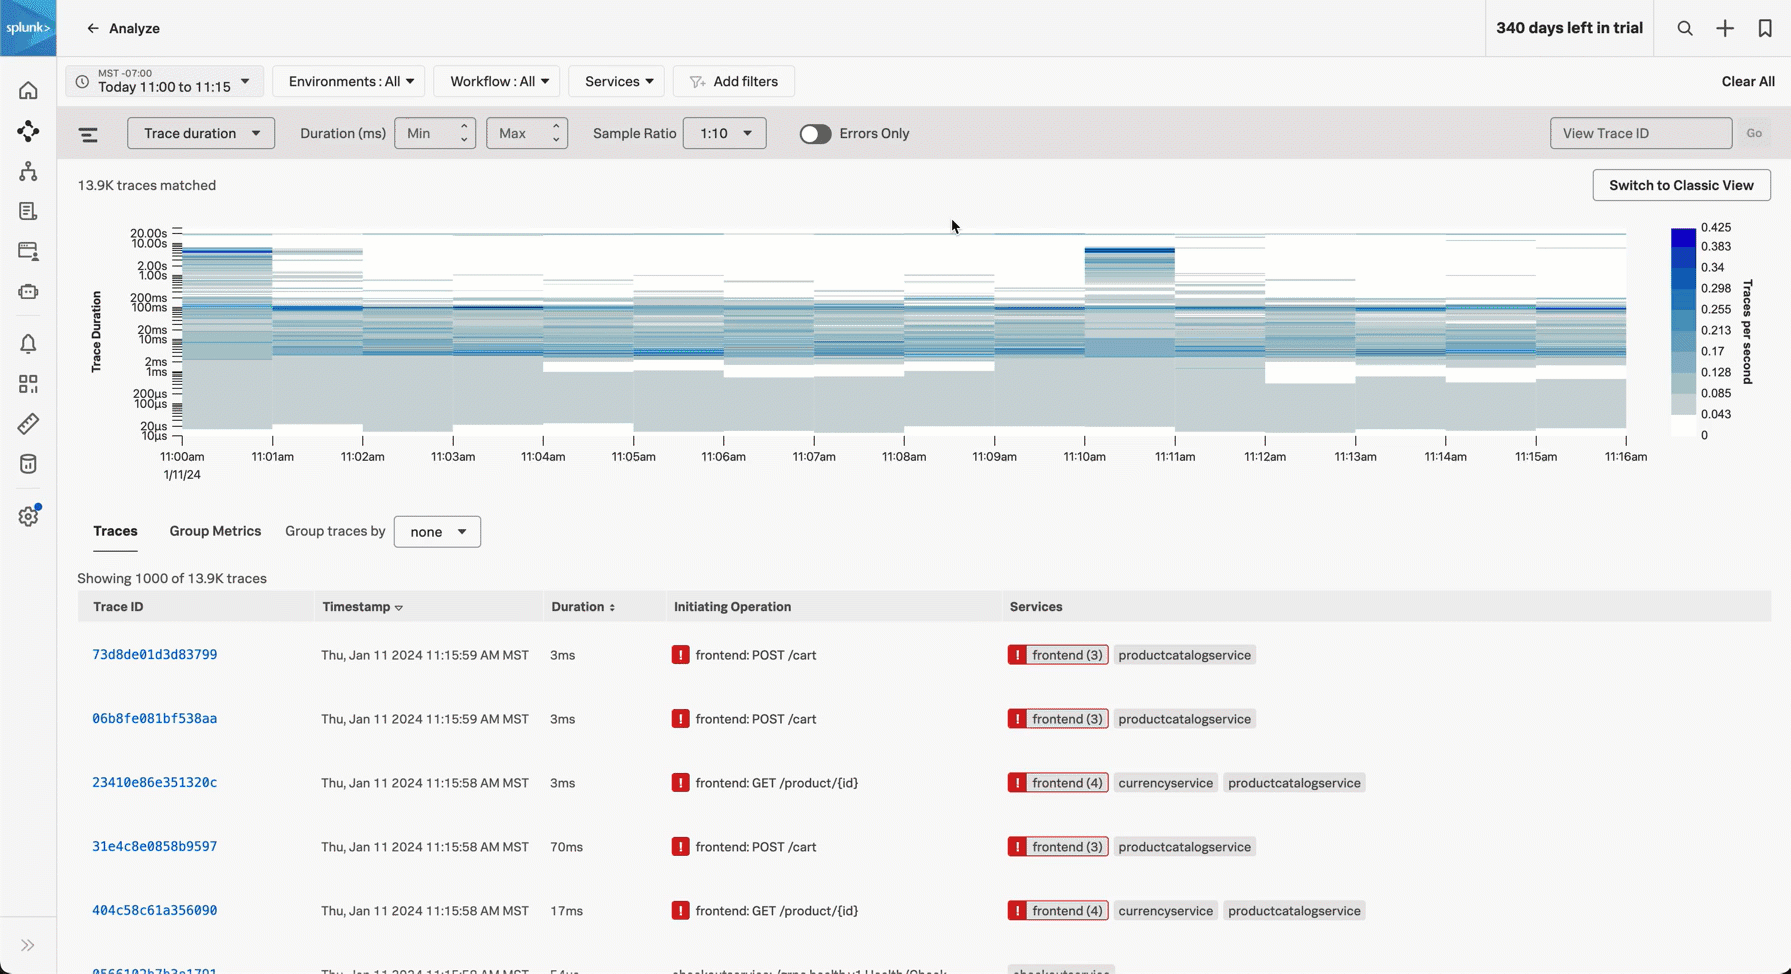
Alex uses the trace duration view in Trace Analyzer and filters the time range
Alex reviews the heatmap for a high rate of high-duration traces
Alex sorts the table of traces to review high-duration traces
Alex uses the trace duration view in Trace Analyzer and filters the time range 🔗
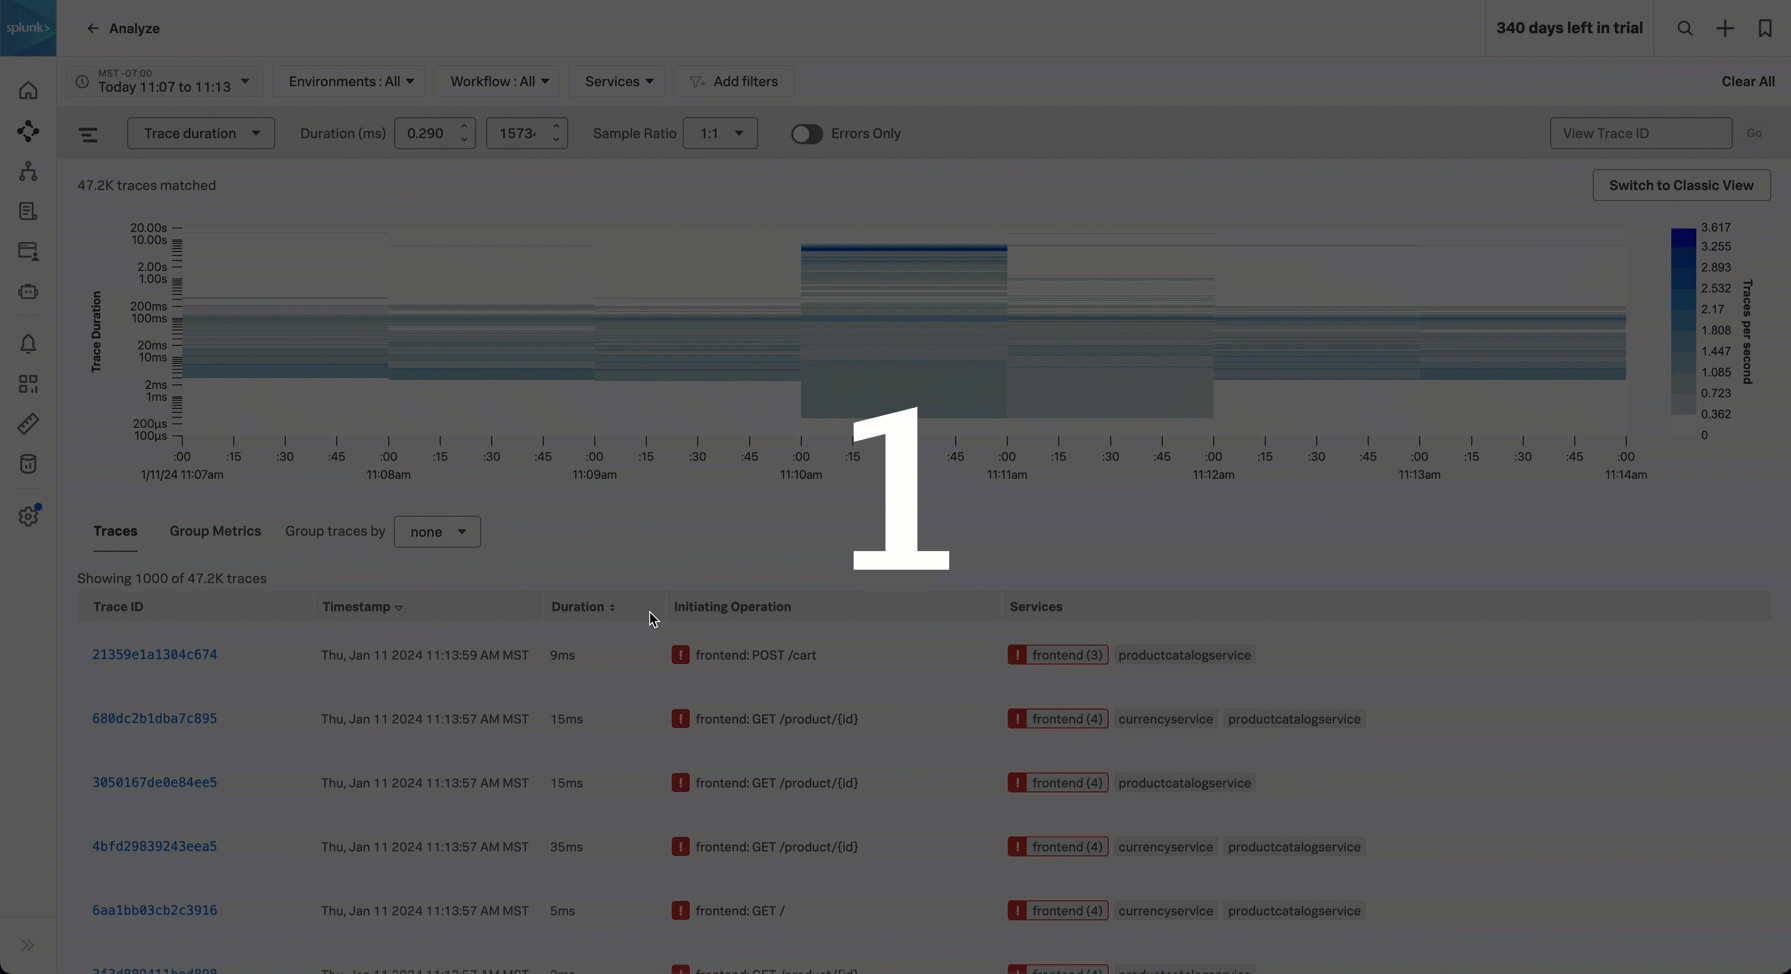
Customer support shared that the customer reports of slowness started around 11:00 AM. So, Alex selects the trace duration view in Trace Analyzer and filters to the time range that matches the customer’s report.
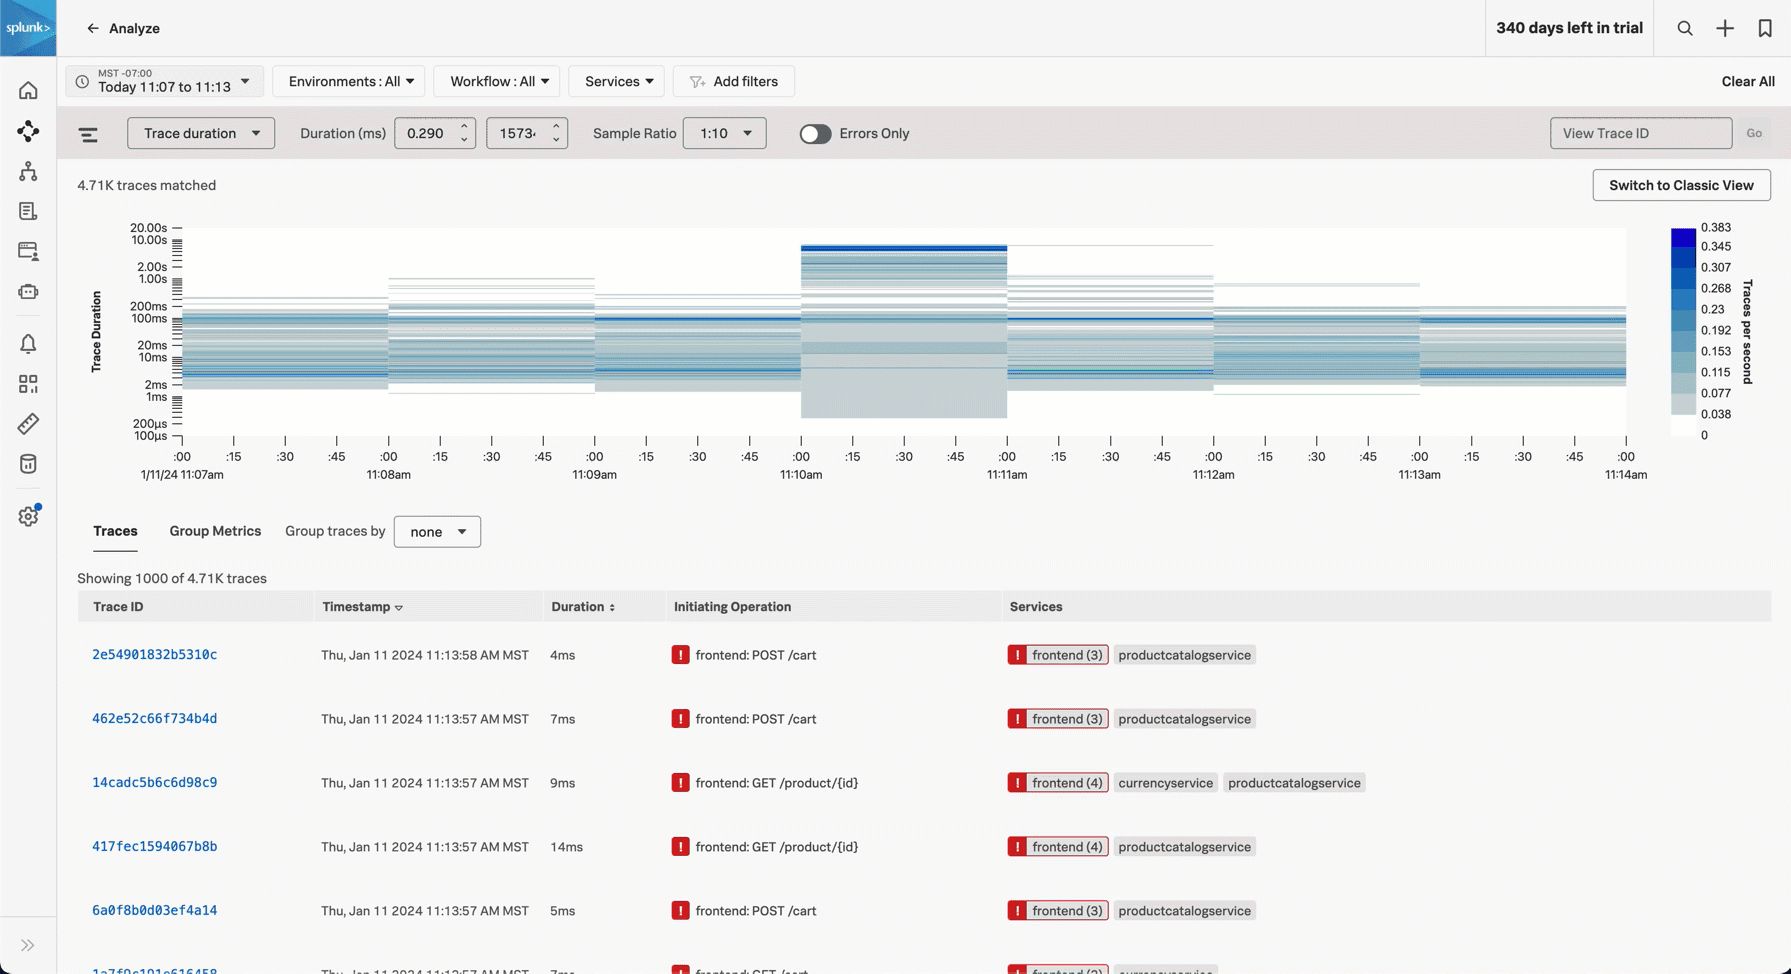
Alex zooms in on the trace duration heatmap 🔗
Alex selects the time period in the trace duration heatmap that shows a higher rate of traces with longer trace durations to further refine the traces in the table.
Alex turns off sampling 🔗
Alex selects 1:1 for the Sample Ratio so that they can view all traces that match their criteria.
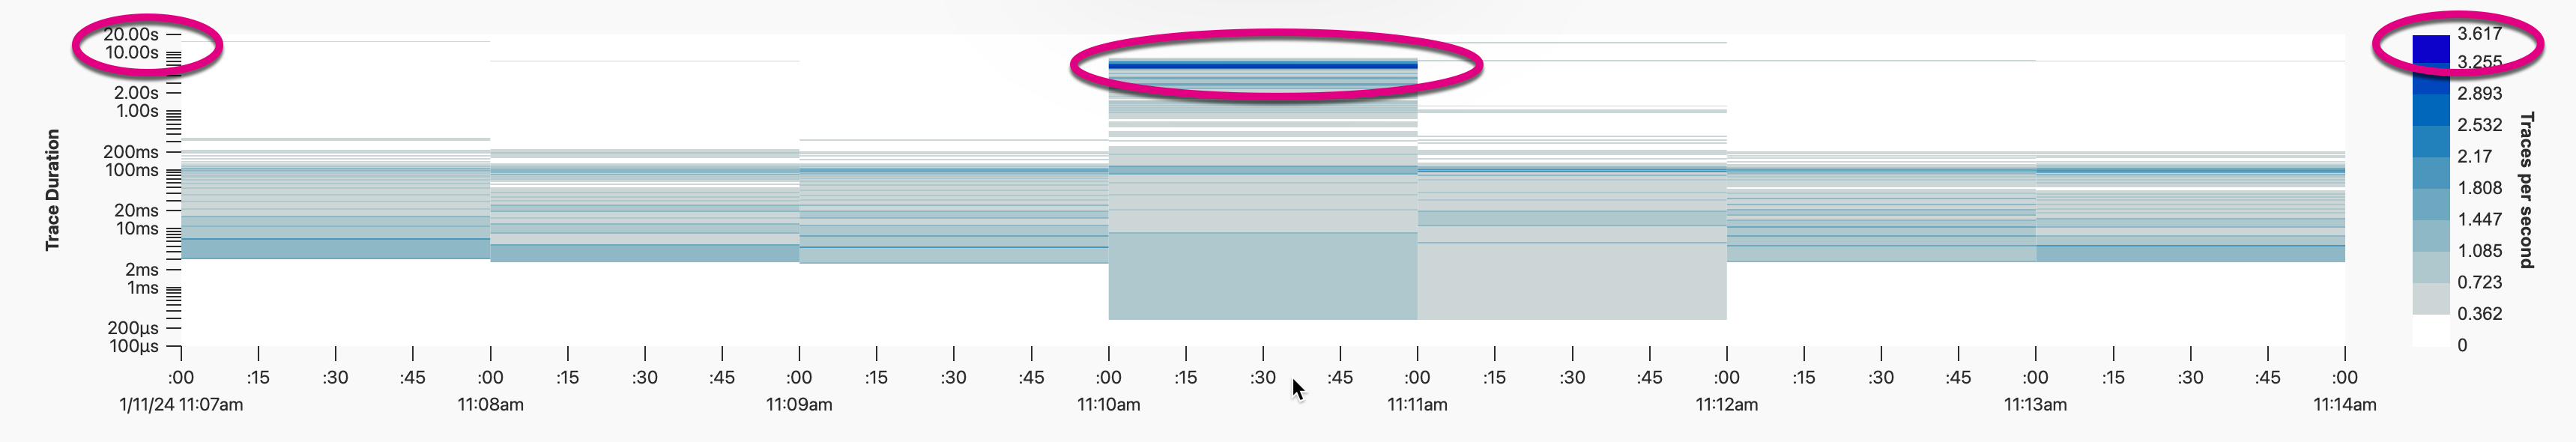
Alex reviews the heatmap for a high rate of high-duration traces 🔗
Alex uses the heatmap to better understand trace durations for the time period reported by the customer. Alex notes the darker area of the heatmap at 11:10 AM which tells them that there was a high trace per second rate (between 3 and 4 traces per second) with durations of 10 or more seconds.
Alex sorts the table of traces to review high-duration traces 🔗
Alex sorts the table of traces by duration so that they can review the high-duration traces.
Summary 🔗
Using the high-resolution data provided by full-fidelity tracing, Alex managed to quickly determine the prevalence of slowness. Using filtering and the trace duration heatmap, Alex quickly isolated high-duration traces to provide to the engineers to isolate the issue.
Learn more 🔗
For more information on Trace Analyzer, see Explore your traces using Trace Analyzer in Splunk APM.
For another Trace Analyzer scenario, see Scenario: Alex troubleshoots an issue to find the root cause using Trace Analyzer.
For a list of APM key concepts, see Key concepts in Splunk APM.
For more Splunk APM scenarios, see Scenarios for troubleshooting errors and monitoring application performance using Splunk APM.