Scenario: Kai investigates the root cause of an error with the Splunk APM service map 🔗
Kai, a site reliability engineer at Buttercup Games, receives tickets from multiple customers getting “Invalid request” errors when purchasing games on the Buttercup Games website.
To troubleshoot the invalid request error reports, Kai takes the following steps:
Kai opens the service map 🔗
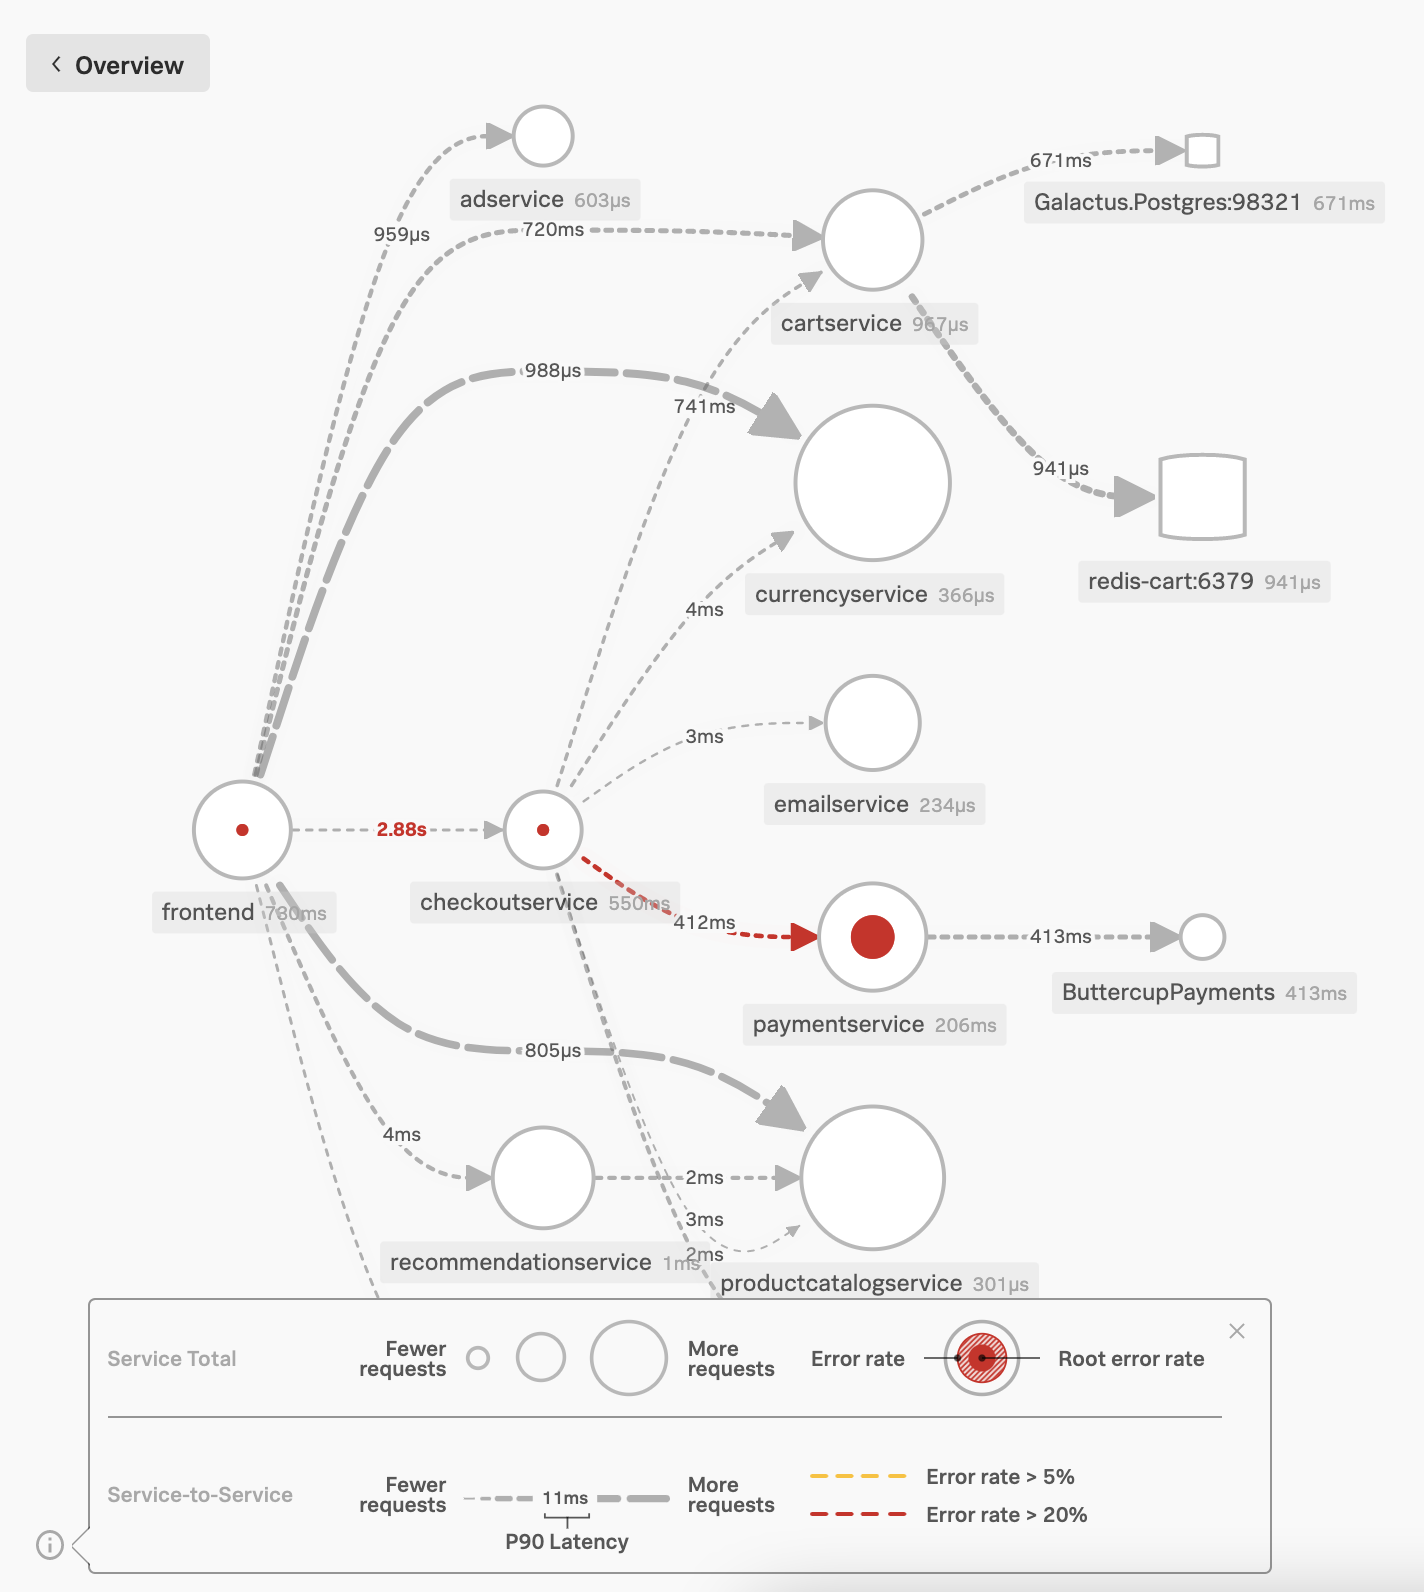
To investigate the downstream service causing the error, Kai searches for “service map” and selects the navigation item in the search results to go directly to the Service Map in APM. Kai looks through the real-time service map, which contains nodes and dependencies of services instrumented in Splunk APM.
Kai looks for services that have root-cause errors 🔗
The service map identifies the root cause error rate using red. Kai finds that the paymentservice node has a red dot, and the dependency arrow from the checkoutservice node and the paymentservice node is red.
Kai selects the service to gather more details 🔗
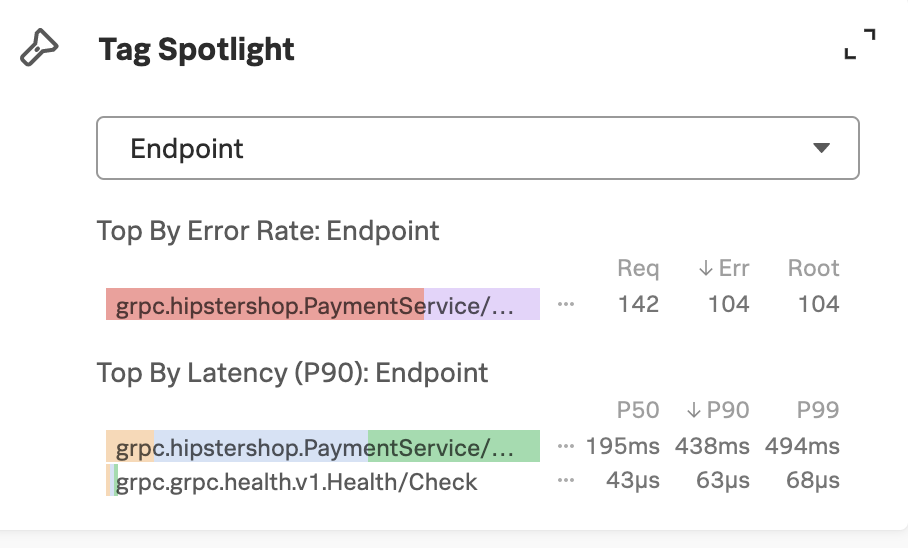
Kai selects the paymentservice node to discover the endpoint with the top error rate in the Tag Spotlight sidebar. Kai finds that all of the errors occur in one endpoint, as shown in the following screenshot:
Kai adds a link to Tag Spotlight for the offending endpoint to the customer ticket 🔗
Kai gets a link to the Tag Spotlight for the endpoint and includes it in a note they add to the customer tickets identifying the endpoint as the root cause of the error. Kai sends the ticket to the payment service owner for further troubleshooting.
Summary 🔗
Kai used the service map to quickly isolate a service with a high root cause error rate and identified it as the likely culprit of invalid request errors customers were reporting. Kai shares this info with the service owner for further troubleshooting.
Learn more 🔗
To learn more about the service map in Splunk APM, see View dependencies among your services in the service map.
For information about how to instrument your applications to send application metrics and traces to Splunk Observability Cloud, see Instrument back-end applications to send spans to Splunk APM.