View dependencies among your services in the service map 🔗
The service map displays the dependencies and connections among your instrumented and inferred services in APM. The map is dynamically generated based on your selections in the time range, environment, workflow, service, and tag filters. You can use the service map to identify dependencies, performance bottlenecks, and error propagation.
For a detailed scenario involving the service map, see Scenario: Kai investigates the root cause of an error with the Splunk APM service map.
See Analyze the performance of inferred services to learn more about inferred services in APM.
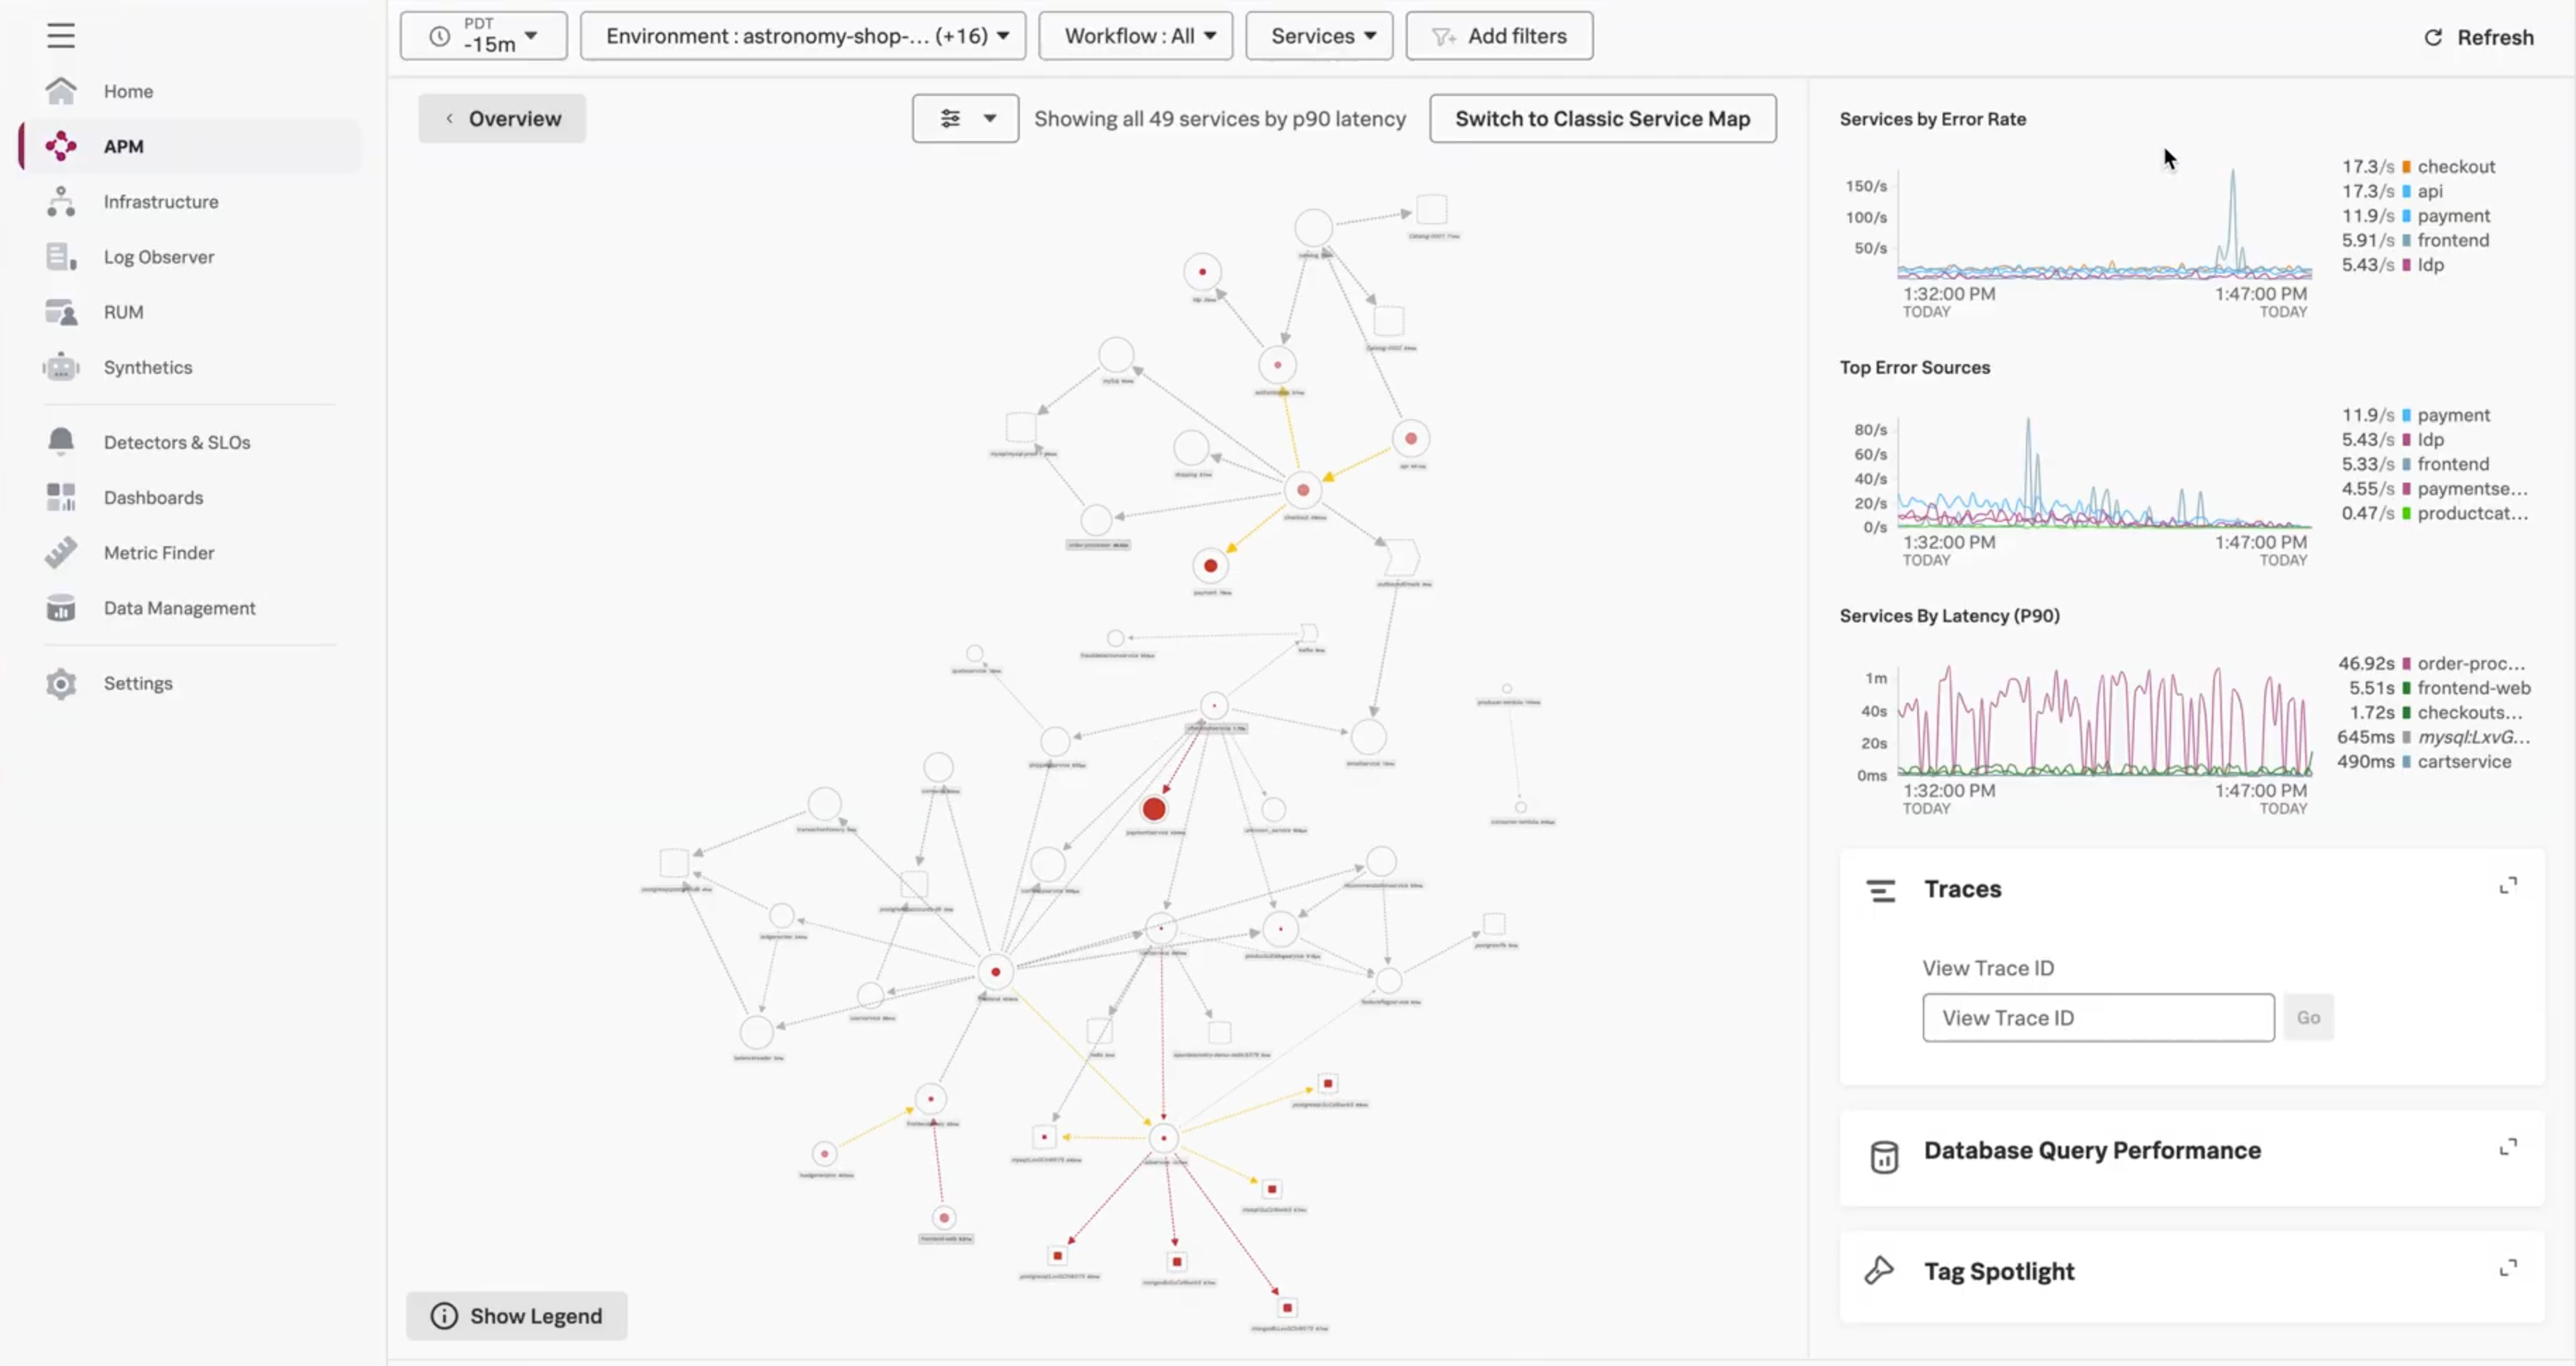
The following screenshot shows an example service map:
Access the service map 🔗
Use these steps to access the service map in Splunk APM:
Log into Splunk Observability Cloud.
Select APM in the navigation bar.
Select Service Map on the APM landing page. The service map view opens, with the service map in the center.
(Optional) Select Switch to Classic Service Map to switch to the lateral service map layout. The default constellation view displays a larger view of your environment and helps you quickly assess service performance.
Using the service map, you can do the following:
Hover over a node or edge to view a pop-up chart of the request, error, and latency (RED) metrics for that node or edge.
Select any node in the service map to see charts for that node in the service panel.
Select on a node in the service map to isolate that node and its immediate dependencies in the service map.
Use the Breakdown selector to break the service’s activity down by any indexed span tag. See Perform breakdowns in the service map to learn more.
Select any chart in this view to show example traces that match the parameters of the chart.
You can also use the service map as a starting point for monitoring or troubleshooting scenarios:
To get real-time monitoring insights on the service, select View Dashboard in the side panel to view the built-in service dashboard. See Track service performance using dashboards in Splunk APM to learn more.
To do more extensive troubleshooting, select the Tag Spotlight tab in the side panel to open Tag Spotlight. See Analyze service performance with Tag Spotlight to learn more.
Filter the service map 🔗
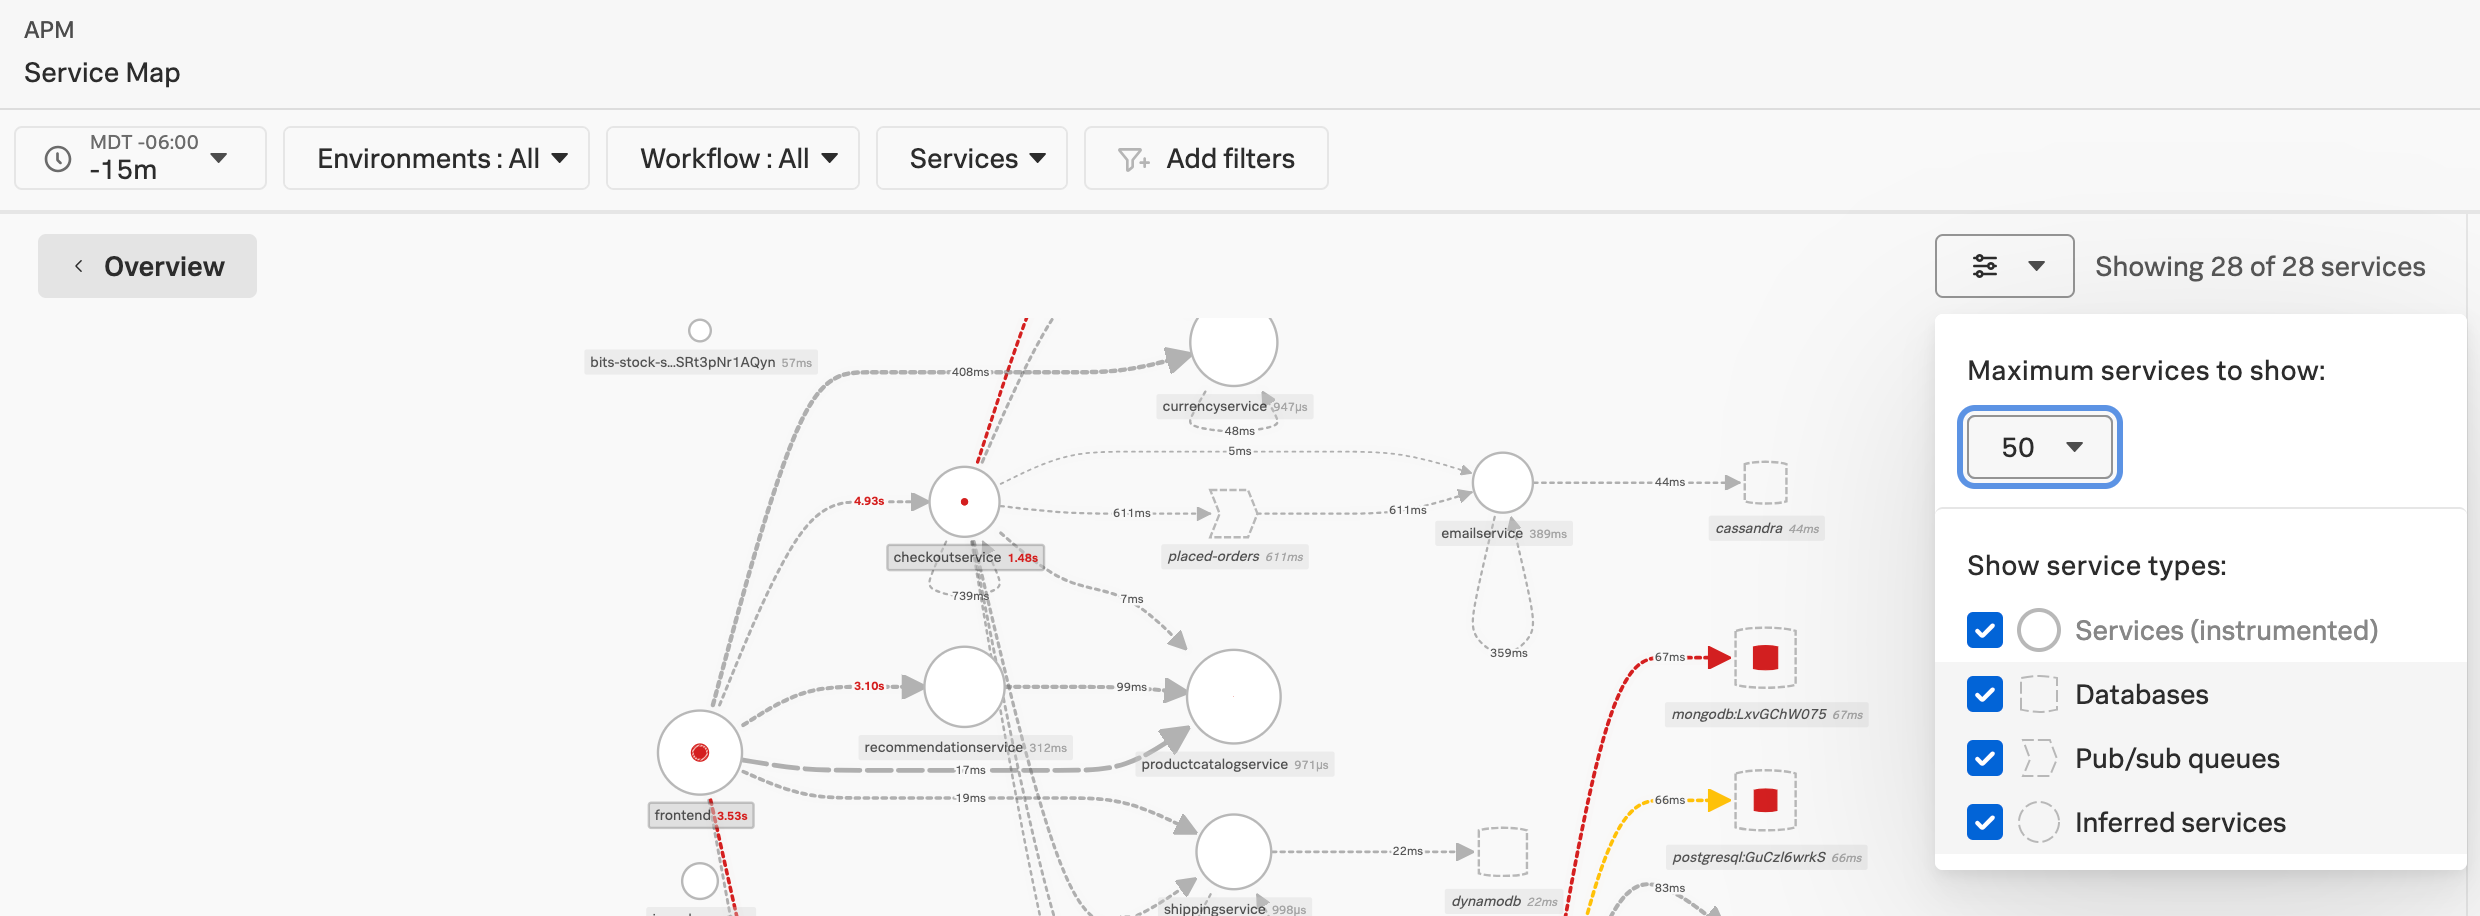
Select the filter menu to change the maximum or the types of services that display on the service map. The service map shows all service types by default. There is also a default maximum of 50 services.
Perform breakdowns in the service map 🔗
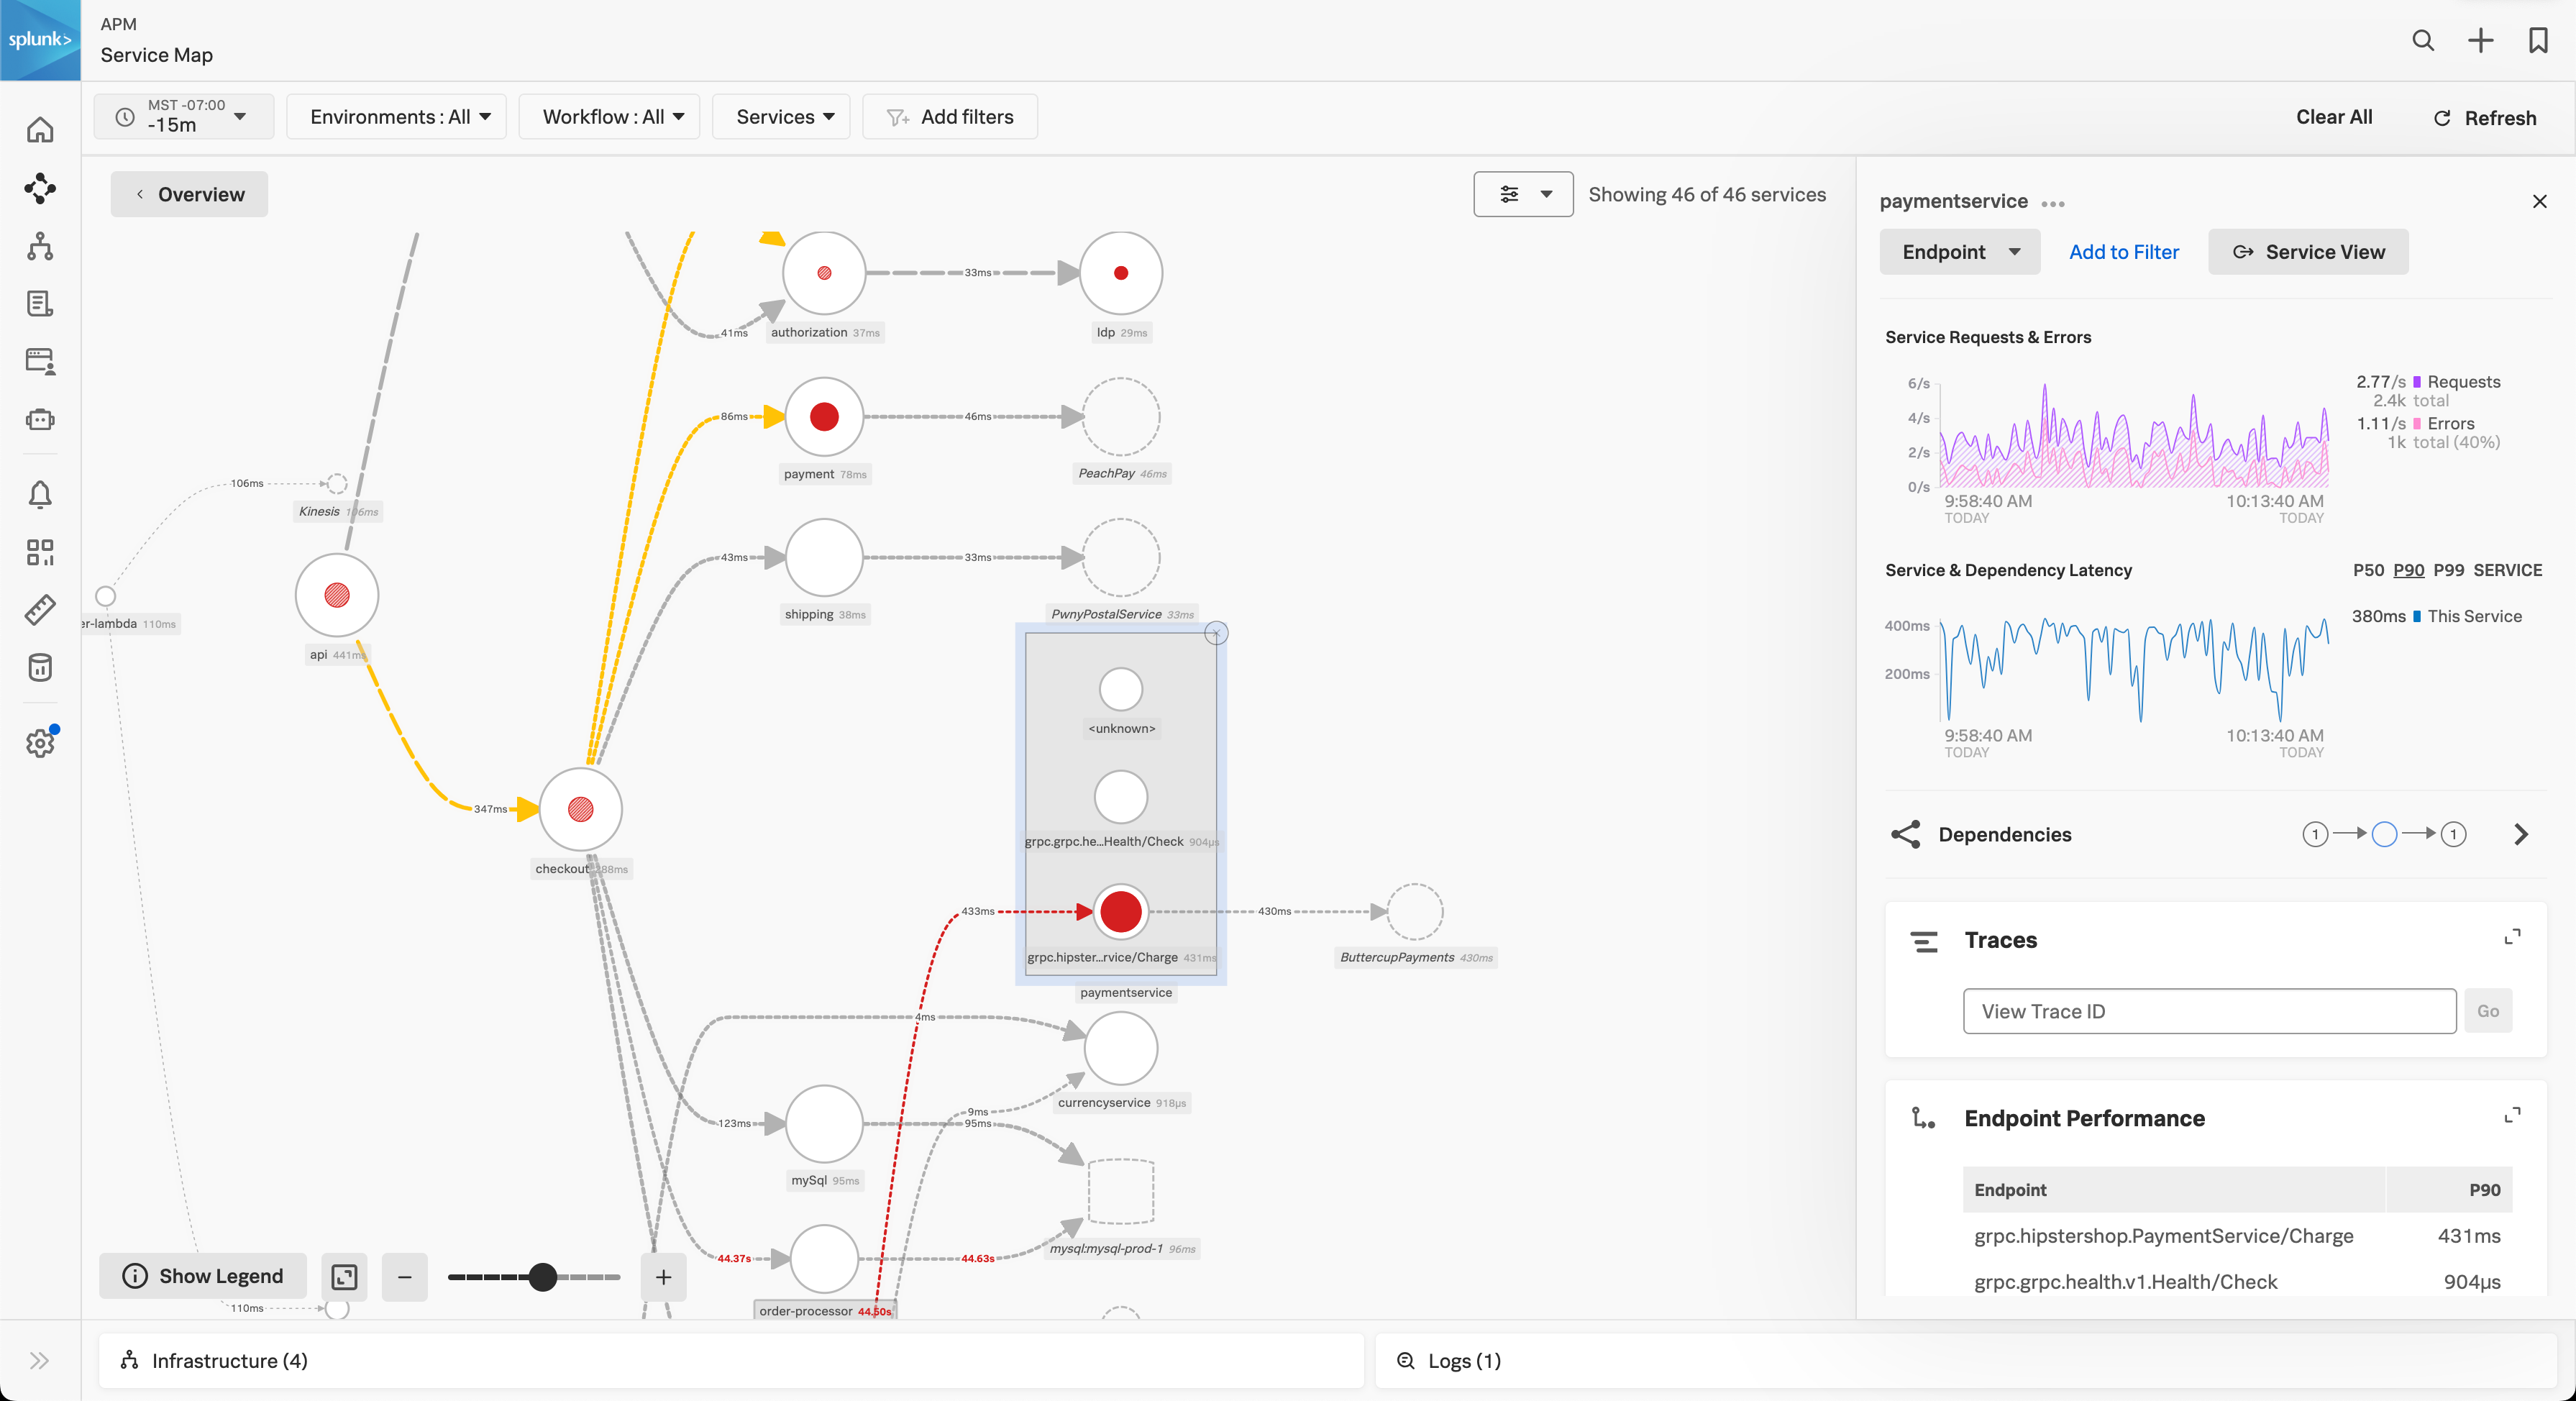
The following screenshot shows an example service map in which the paymentservice node is broken down by endpoint, showing that errors with the payment service are occurring in the /Charge endpoint.
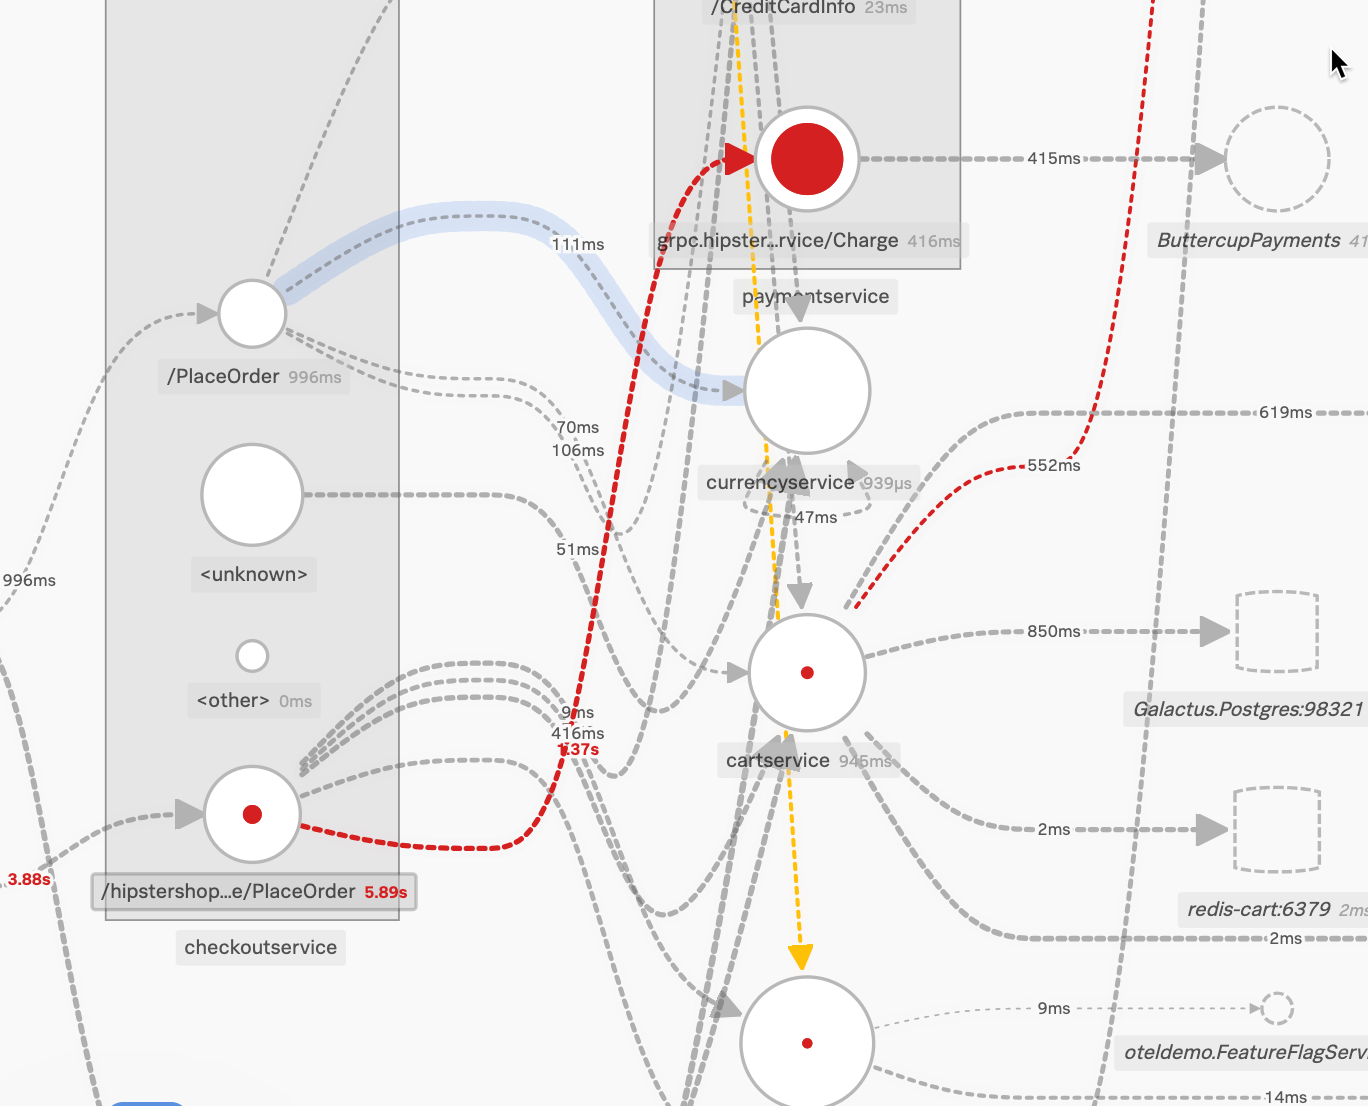
The following image shows the same service map with an additional breakdown on the checkoutservice by endpoint. This shows that the errors occurring in the /Charge endpoint of the paymentservice originate in the /placeOrder endpoint of the checkoutservice.
To breakdown the service map:
Select a service you’re interested in.
In the service tab, select Breakdown and select an option from the menu. This breaks down your view of the service by the feature you select. For example, select Endpoint then Latency (P90) to break the service node down into its endpoints, ranked from highest to lowest by 90th percentile latency. If there are more than 5 breakdown values, the breakdown shows the top 5 and groups the remainder into a node labeled <other>.
(Optional) Select a node within the breakdown to further break down the visualization by another feature.
Configure Related Content for your service map 🔗
You can configure specific metadata to activate Related Content in your service map. Related Content automatically correlates data between APM, Infrastructure Monitoring, and Log Observer to pass filters around Splunk Observability Cloud.
When configured, you can select tiles in the Related Content bar to seamlessly navigate from 1 view to another in Splunk Observability Cloud. The following animation shows a user navigating from APM to Infrastructure Monitoring. See Related Content in Splunk Observability Cloud for information about how to configure related content to display in your service map.
Service map thresholds and limits 🔗
The following table presents applicable thresholds and limits in the service map:
Description |
Threshold value |
|---|---|
Error rate in “risk” zone, displayed in yellow |
5% |
Error rate in “critical” zone, displayed in red |
20% |
P90 latency in “critical” zone, displayed in red |
1 second |
Default maximum number of nodes visible in the service map. Use the filter menu on the map to change the maximum number of services to show. |
50 service nodes |
Maximum number of nodes visible in the service map at once |
200 service nodes |
Character limit for service and operation names |
1024 characters |