Analyzing error spans in Splunk APM 🔗
With Splunk APM error detection, you can isolate specific causes of errors in your system and applications.
How Splunk APM detects error spans 🔗
Each span in Splunk APM captures a single operation. Splunk APM considers a span to be an error span if the operation that the span captures results in an error as defined by the following conditions:
The
otel.status_codefield for the span isERROR.otel.status_codeis set in the Splunk Distribution of the OpenTelemetry instrumentation using the native OTel fieldspan.status.span.status, and subsequentlyotel.status_code, are set based on either the HTTP status code or the gRPC status code.See How OpenTelemetry handles HTTP status codes to learn which status code values set
otel.status_codetoERRORin the OpenTelemetry instrumentation.See How OpenTelemetry handles gRPC status codes to learn which
rpc.grpc.status_codetag values setotel.status_codetoERRORin the OpenTelemetry instrumentation.
The
errortag for the span is set to a truthy value, which is any value other thanFalseor0.
See the Span Status section of the OpenTelemetry Transformation to non-OTLP Formats spec on GitHub https://opentelemetry.io/docs/specs/otel/common/mapping-to-non-otlp/#span-status to learn more about otel.status_code. See the Set Status section of the OpenTelemetry Tracing API specification on GitHub https://github.com/open-telemetry/opentelemetry-specification/blob/main/specification/trace/api.md#set-status to learn more about span.status.
How OpenTelemetry handles HTTP status codes 🔗
The following table provides an overview of how HTTP status codes are used to set the span.status field, and subsequently otel.status_code, in OpenTelemetry instrumentation in accordance with OpenTelemetry semantic conventions. To learn more, see the OpenTelemetry semantic conventions for HTTP spans on GitHub https://github.com/open-telemetry/semantic-conventions/blob/main/model/http/spans.yaml.
Error type |
Server-side spans |
Client-side spans |
|---|---|---|
|
|
|
|
Not considered a server-side error. |
Counted as a client error. |
|
|
|
How OpenTelemetry handles gRPC status codes 🔗
To determine if a gRPC span counts towards the error rate for a service, Splunk APM looks at the otel.status_code field as set by OpenTelemetry instrumentation. The following logic is applied by the instrumentation in accordance with OpenTelemetry semantic conventions:
Code |
Status |
Server-side spans |
Client-side spans |
|---|---|---|---|
0 |
OK |
unset |
unset |
1 |
CANCELLED |
unset |
ERROR |
2 |
UNKNOWN |
ERROR |
ERROR |
3 |
INVALID_ARGUMENT |
unset |
ERROR |
4 |
DEADLINE_EXCEEDED |
ERROR |
ERROR |
5 |
NOT_FOUND |
unset |
ERROR |
6 |
ALREADY_EXISTS |
unset |
ERROR |
7 |
PERMISSION_DENIED |
unset |
ERROR |
8 |
RESOURCE_EXHAUSTED |
unset |
ERROR |
9 |
FAILED_PRECONDITION |
unset |
ERROR |
10 |
ABORTED |
unset |
ERROR |
11 |
OUT_OF_RANGE |
unset |
ERROR |
12 |
UNIMPLEMENTED |
ERROR |
ERROR |
13 |
INTERNAL |
ERROR |
ERROR |
14 |
UNAVAILABLE |
ERROR |
ERROR |
15 |
DATA_LOSS |
ERROR |
ERROR |
16 |
UNAUTHENTICATED |
unset |
ERROR |
See the OpenTelemetry specification for information on the handling of gRPC status codes on GitHub https://github.com/open-telemetry/semantic-conventions/blob/main/model/rpc/spans.yaml.
How error spans are counted in MetricSets 🔗
To generate endpoint-level Monitoring MetricSets, Splunk APM turns endpoint spans, which are spans with span.kind = SERVER or span.kind = CONSUMER, into error metric data. If a span is considered an error per the Error rules in Splunk APM, that span counts towards errors in the Monitoring MetricSet for the endpoint associated with that span.
Service-level Monitoring MetricSets are based on the number of error spans in each of the service’s endpoints.
Server-side and client-side error counting 🔗
Splunk APM captures all spans from all instrumented services, including spans capturing requests made to clients, called client-side spans, and requests received by services, called server-side spans. In certain cases, when a service returns an error, the error can be registered in both the initiating span and the receiving span. To avoid duplicated error reports, Splunk APM counts only the server-side error spans in MetricSets and error totals.
For example, when service_a makes a call to service_b and both services are fully instrumented, Splunk APM receives the following two spans:
span_1, a span withspan.kind = CLIENTthat capturesservice_amaking the call toservice_bspan_2, a span withspan.kind = SERVERthat capturesservice_breceiving the request
If service_b returns a 500 error, both spans receive that error. To avoid double-counting errors, Splunk APM counts only the server-side span, span_2, as an error in MetricSets and error totals.
What is the difference between an error and a root cause error? 🔗
To help you identify the root cause of an error, Splunk APM differentiates between errors and root cause errors. For example, the request and error graph in Tag Spotlight differentiates root cause errors from total errors with a darker color:
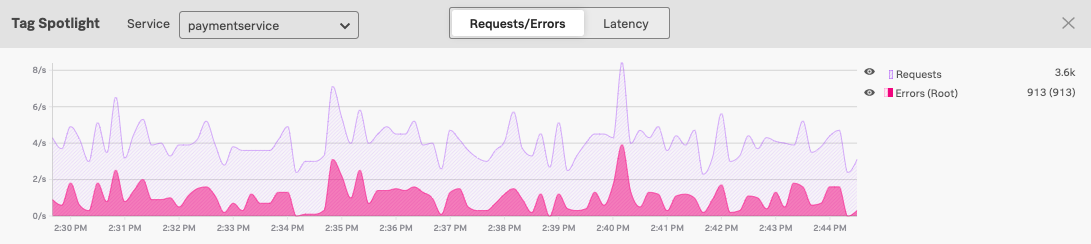
When a particular span within a trace results in an error, the error can propagate through other spans in the trace. Any span determined to contain an error based on the criteria described in How Splunk APM detects error spans is an error span. Splunk APM designates the originating error of a chain of error spans as the root cause error.
For example, consider the checkout trace in the following screenshot:
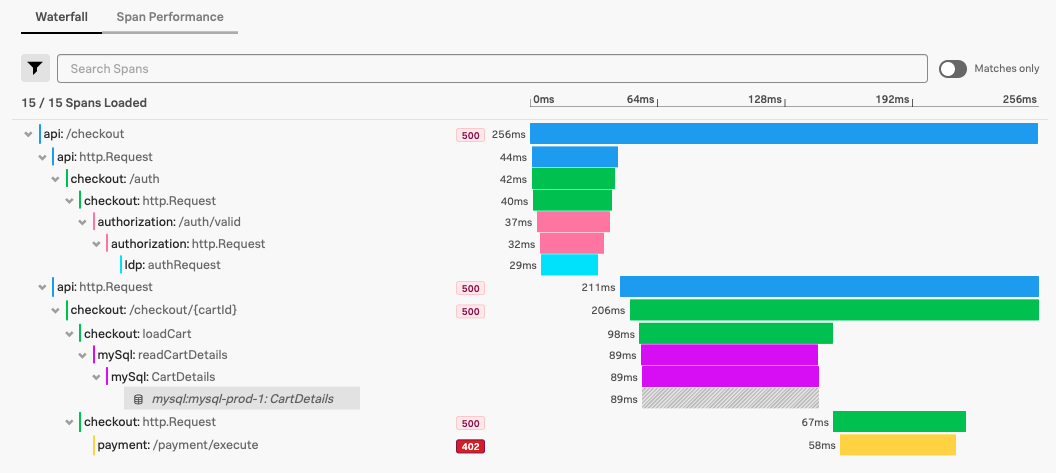
The checkout service makes HTTP requests to the authorization service, the checkout service, and the payment service. The HTTP request to the payment service results in a 402 “Payment Required” error. Because the request to the payment service failed, the initiating requests to checkout service and http.Request also result in errors.
In this case, the source error, or root cause error, is the 402 error in the payment service. The 500 errors appearing in the checkout and api services are subsequent errors.
The root cause error count indicates the count of these root cause errors, while the standard error count indicates the total count of all root cause errors as well as any subsequent errors.
Customize the error logic in Splunk APM 🔗
In certain cases, you might want to modify your instrumentation to override defaults in the error logic or devise another method of tracking errors that matter to you.
Count 4xx status codes as errors 🔗
By default, Splunk APM does not count server-side spans with 4xx status codes as errors, because a 4xx status code is often associated with a problem with the request itself, rather than a problem with the service handling a request.
For example, if a user makes a request to endpoint/that/does/not/exist, the 404 status code the service returns does not mean there’s a problem with the service. Instead, it means there was a problem with the request, which is trying to call an endpoint that doesn’t exist. Similarly, if a user tries to access a resource they don’t have access to, the service might return a 401 status code, which is typically not the result of an error on the server side.
However, depending on your application’s logic, a 4xx status code might represent a meaningful error, particularly for client-side requests. To monitor for 4xx errors, try doing the following:
Break down performance by HTTP status code span tags, if available.
Customize your instrumentation to set the
span.statusof spans with meaningful4xxstatus codes toError.
For example, if Kai wants to alert on the rate of 401 errors returned by a given service, they do the following:
Index
http.status_codein libraries that support OpenTelemetry semantic conventions version 1.16.0 or lower. Or indexhttp.response.status_codein libraries that support OpenTelemetry semantic conventions version 1.17.0 or higher. See Index span tags to create Troubleshooting MetricSets.Create a custom Monitoring MetricSet on the status code tag for the service’s endpoints to get a time series for each status code. See Create a Monitoring MetricSet with a custom dimension.
Set up an alert on the rate of
401errors as compared to all requests. See Configure detectors and alerts in Splunk APM.
Customize error logic to discard 5xx status codes 🔗
By default, Splunk APM counts server-side spans with 5xx status codes as errors, because a 5xx error is typically associated with service unavailability.
For example, a 503 “service too busy” error in a server-side span counts as an error by default. If the service you’re monitoring is the front end of a public website, users encountering a 503 error aren’t able to use the website, resulting in lost user interactions or lost revenue. In this case, a 503 is a true error.
Depending on your application’s logic, however, you might not consider 5xx codes to be meaningful errors. For example, if your service is a batch processor, a 503 error can be a normal flow control mechanism, triggering clients to retry their requests later. To override the default that counts 503 status codes as errors, you can modify your instrumentation to set span.status to OK in the spans where a 503 error is not a concern.