Index span tags to create Troubleshooting MetricSets 🔗
Use span tags or processes to break down services and inter-service calls along trace characteristics or attributes. To get additional value from a span tag or process, a Splunk APM administrator can run an action known as indexing, which activates additional analysis of the indexed span tag or process. One benefit of indexing is to get aggregated metrics, called MetricSets, across all spans that contain a specified indexed tag or process.
What are MetricSets? 🔗
MetricSets are metric time series (MTS) you can use to track the performance of specific metrics over time. To help you analyze your service performance, APM provides 2 categories of MetricSets: Troubleshooting MetricSets (TMS) and Monitoring MetricSets (MMS). Use Troubleshooting MetricSets for high-cardinality troubleshooting. Use Monitoring MetricSets for real-time monitoring and alerting.
APM provides a collection of MetricSets by default. You can also index additional span tags or processes to create additional TMS and, as part of the indexing process, you can opt to create custom dimensionalized Monitoring MetricSets (MMS). See Learn about MetricSets in APM for an overview of the types of MetricSets in APM and a list of the MetricSets available by default.
Use this topic to learn how to index a span tag or process to create Troubleshooting MetricSets. See Create a Monitoring MetricSet with a custom dimension to learn how to add custom dimensionalized Monitoring MetricSets.
Prerequisites 🔗
To index span tags to create Troubleshooting MetricSets in Splunk APM, you must have the admin role.
Before indexing span tags and processes, see Reference and best practices for span tags and Troubleshooting MetricSets for guidance on choosing span tags or processes to index.
Use Troubleshooting MetricSets to filter and breakdown metrics 🔗
Every Troubleshooting MetricSet (TMS) creates the following metrics, also known as Request, Error, and Duration (RED) metrics. The following metrics appear when you select a service from the service map in the Troubleshooting view:
Request rate
Error rate
Root cause error rate
p50, p90, and p99 latency
The measurement precision of Troubleshooting MetricSets is 10 seconds. Splunk APM reports quantiles from a distribution of metrics for each 10-second reporting window.
TMS appear on the service map and in Tag Spotlight. Use TMS to filter the service map and create breakdowns across the values of a given indexed span tag or process.
See Scenario: Kai investigates the root cause of an error with the Splunk APM service map to learn more about using RED metrics in the service map.
See Scenario: Deepu finds the root cause of an error using Tag Spotlight to learn how indexed tags are used in troubleshooting.
Index a new span tag or process 🔗
Follow these steps to index a span tag or process to create a Troubleshooting MetricSet.
To get to the APM MetricSets page, do one of the following:
In Splunk APM, select APM Configuration and select APM MetricSets from the menu. The APM MetricSets page opens.
From anywhere in Splunk Observability Cloud, select Settings in the navigation bar and select APM MetricSets under Data Configuration.
On the APM MetricSets page, select New MetricSet.
Enter the Name of a span tag or process you want to index.
The Scope determines how APM associates the span tag or process with services in a trace:
Select Service to associate the span tag or process with services. This means the value of the span tag or process might change across services in a given trace. Select
All Servicesto index the span tag or process for every service. Select specific services to index the span tag or process for only those services.Note
If you index a span tag or process at the service level, you can also use it as a custom dimension in Monitoring MetricSets. See Create a Monitoring MetricSet with a custom dimension for instructions.
Select Global to associate the span tag or process with traces. This means the value of the span tag or process is the same for all services in a given trace.
For more information about scope, see Types of span tags you can index.
Select Start Analysis to submit the configuration. Splunk APM runs an analysis of the span tag or process to calculate the potential cardinality contribution of the MetricSet to determine whether it is within your entitlement limit.
Your new metric set shows under Pending MetricSets section of the table with an Analyzing status while the cardinality check runs. You might have to wait a few moments for the check to run.
Caution
Your pending MetricSet expires after 1 hour. If your MetricSet times out before you activate it, run the analysis again.
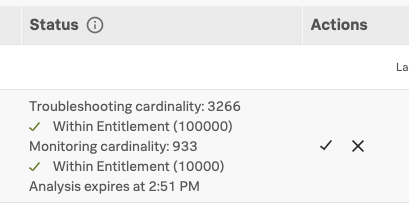
After the cardinality check has run, review the cardinality and activate your new MetricSet.
If the cardinality impact of indexing this new MetricSet is within your subscription limit, you see a green check mark and “Within Entitlement.” Select the check mark under Actions to activate your Troubleshooting MetricSet.
If the cardinality check times out before you activate the MetricSet, run the analysis again.
If the cardinality check shows as failed, your cardinality is over your subscription limit for TMS. See Cardinality contribution of indexed span tags and processes.
The following example shows a cardinality check.
Manage existing Troubleshooting MetricSets 🔗
After you’ve successfully indexed a span tag or process, Splunk APM saves the configuration in the APM MetricSets page in Data Configuration. Go to this page to view the index scope and status of the span tag or process.
You can modify the configuration for existing indexed tags and processes, including adding and removing services for specific indexed tags or processes and modifying the scope. You can also pause or stop indexing without deleting the configuration. This is useful when you want to temporarily stop indexing a span tag or process, but don’t want to remove the configuration.
To review or modify existing indexed span tags or processes, do the following:
Go to Settings then Data Configuration then APM MetricSets.
Find the indexed span tag or process you want to view under the Custom MetricSets section of the configuration table.
See Status of configured Troubleshooting MetricSets to interpret the status of each indexed span tag or process.
Make any desired changes using the buttons in the Actions column:
Use the pencil button to edit the scope of an indexed span tag or process.
Use the pause button to pause generating MetricSets for a given span tag or process.
Use the trash button to delete a MetricSet configuration.
Status of configured Troubleshooting MetricSets 🔗
After you’ve configured custom Troubleshooting MetricSets you can see their status. The following table lists all available statuses:
Status |
Description |
|---|---|
Active |
The application is indexing the span tag or process to create Troubleshooting MetricSets. |
Paused |
You or another administrator paused indexing for the span tag or process. The application isn’t generating Troubleshooting MetricSets for the span tag or process, and you can’t view any data you previously indexed for it. |
Stopped |
The application stopped indexing the span tag or process and is no longer generating Troubleshooting MetricSets for the span tag or process. You can’t view any data you previously indexed. |
Status of Database MetricSets 🔗
You can pause and resume indexing Database Query Performance data from the Standard MetricSets section of APM MetricSets. You can also control the indexing of SQL and NoSQL tags separately.
To pause the indexing of Database Query Performance data, select Pause indexing next to the database type. To resume, select Resume indexing.