Use the service view for a complete view of your service health 🔗
As a service owners you can use the service view in Splunk APM to get a complete view of your service health in a single pane of glass. The service view includes a service-level indicator (SLI) for availability, dependencies, request, error, and duration (RED) metrics, runtime metrics, infrastructure metrics, Tag Spotlight, endpoints, and logs for a selected service. You can also quickly navigate to code profiling and memory profiling for your service from the service view.
The service view is available for instrumented services, pub/sub queues, databases, and inferred services. See Service view support for various service types for details on the information available for various service types.
Access the service view for your service 🔗
You can access the service view for a specific service in several places.
You can search for the service using the search in the top toolbar.
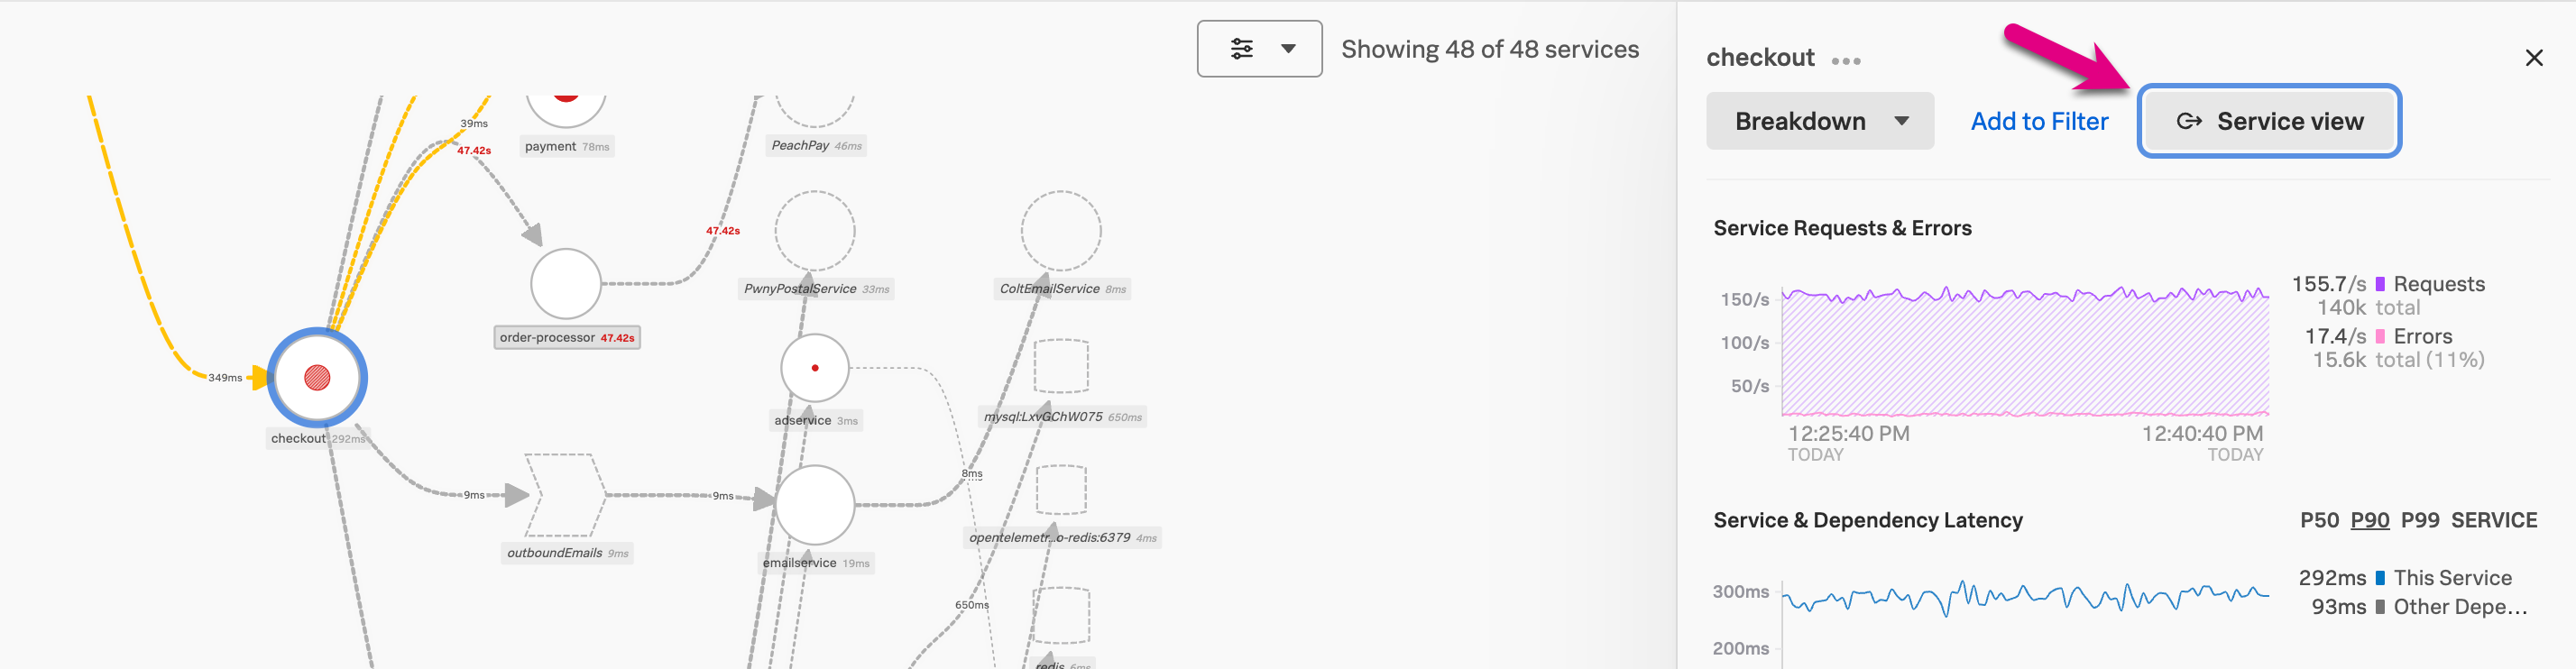
You can also access the service view for a specific service within the service map. Start by selecting Service Map on the APM landing page. Select a service in the service map, then select Service view in the panel.
Finally, you can also access the service view for a specific service by selecting the service from the APM landing page.
Use the service view to monitor the health of your service 🔗
When you open the service view an environment is selected based on your recently viewed environments. Adjust the environment and time range filters if necessary. Use the following sections to monitor the health of your service.
Service metrics 🔗
Use the following metrics in the Service metrics section to monitor the health of your service. Collapse sub-sections that are not relevant to you to customize your service view.
Success rate SLI - The success service-level indicator (SLI) shows the percentage of time requests for your service were successful in the last 30 days. The chart shows successful and unsuccessful requests. If you configured a success rate service-level objective (SLO), an additional chart displays success rate over the compliance window you specified in your objective. See Measure and track your service health metrics with service level objectives (SLOs).
Service map - The service map shows the immediate upstream and downstream dependencies for the service you are viewing. The service map in service view is limited to 20 services, sorted by the most number of requests. Hover over the chart and select View full service map to go to the service map.
Service requests - The service requests chart shows streaming request data for the service. If you have detectors for the service requests configured, triggered alerts display below the chart. Select the chart to view example traces. Select the alert icon to view alert details.
Service latency - The service latency chart shows p50, p90, and p99 latency data for the service. If you have detectors for the service latency configured, triggered alerts display below the chart. Select the chart to view example traces. Select the alert icon to view alert details.
Service error - The service error chart shows streaming error data for the service. If you have detectors for the service error rate configured, triggered alerts display below the chart. Select the chart to view example traces. Select the alert icon to view alert details.
- Dependency latency by type - The dependency latency by type chart shows the latency for each of the downstream systems. Select the chart to see details about each system category. Systems are categorized as follows:
Services - instrumented services
Databases
Inferred services - un-instrumented third-party services
Pub/sub queues - Publisher/subscriber queues
Error breakdown 🔗
Use the following section to troubleshoot service errors and view relevant traces for specific error types. Select a point on the graph to view example traces for a particular data point, or select any value to hide the time series for that value.
Errors by exception type - Displays errors with the span attribute
exception.type. Select a data point on the chart to view related traces and alert details for that time period.Errors by status code - Displays errors based on the HTTP or gRPC error status code. Select a data point on the chart to view related traces and alert details for that selected time period and error. For more information about error status codes, see Semantic Conventions for HTTP Spans .
Runtime metrics 🔗
Instrument your back-end applications to send spans to Splunk APM to view runtime metrics. See Instrument back-end applications to send spans to Splunk APM.
The available runtime metrics vary based on language. See Metric reference for more information.
Infrastructure metrics 🔗
If you are using the Splunk Distribution of the OpenTelemetry Collector and the SignalFx Exporter, infrastructure metrics for the environment and service you are viewing display. See Get started with the Splunk Distribution of the OpenTelemetry Collector and SignalFx exporter.
The following infrastructure metrics are available:
Host CPU usage
Host memory usage
Host disk usage
Host network usage
Pod CPU usage
Pod memory usage
Pod disk usage
Pod network utilization
View Tag Spotlight view for your service 🔗
Select Tag Spotlight to view Tag Spotlight view filtered for your service. See Analyze service performance with Tag Spotlight to learn more about Tag Spotlight.
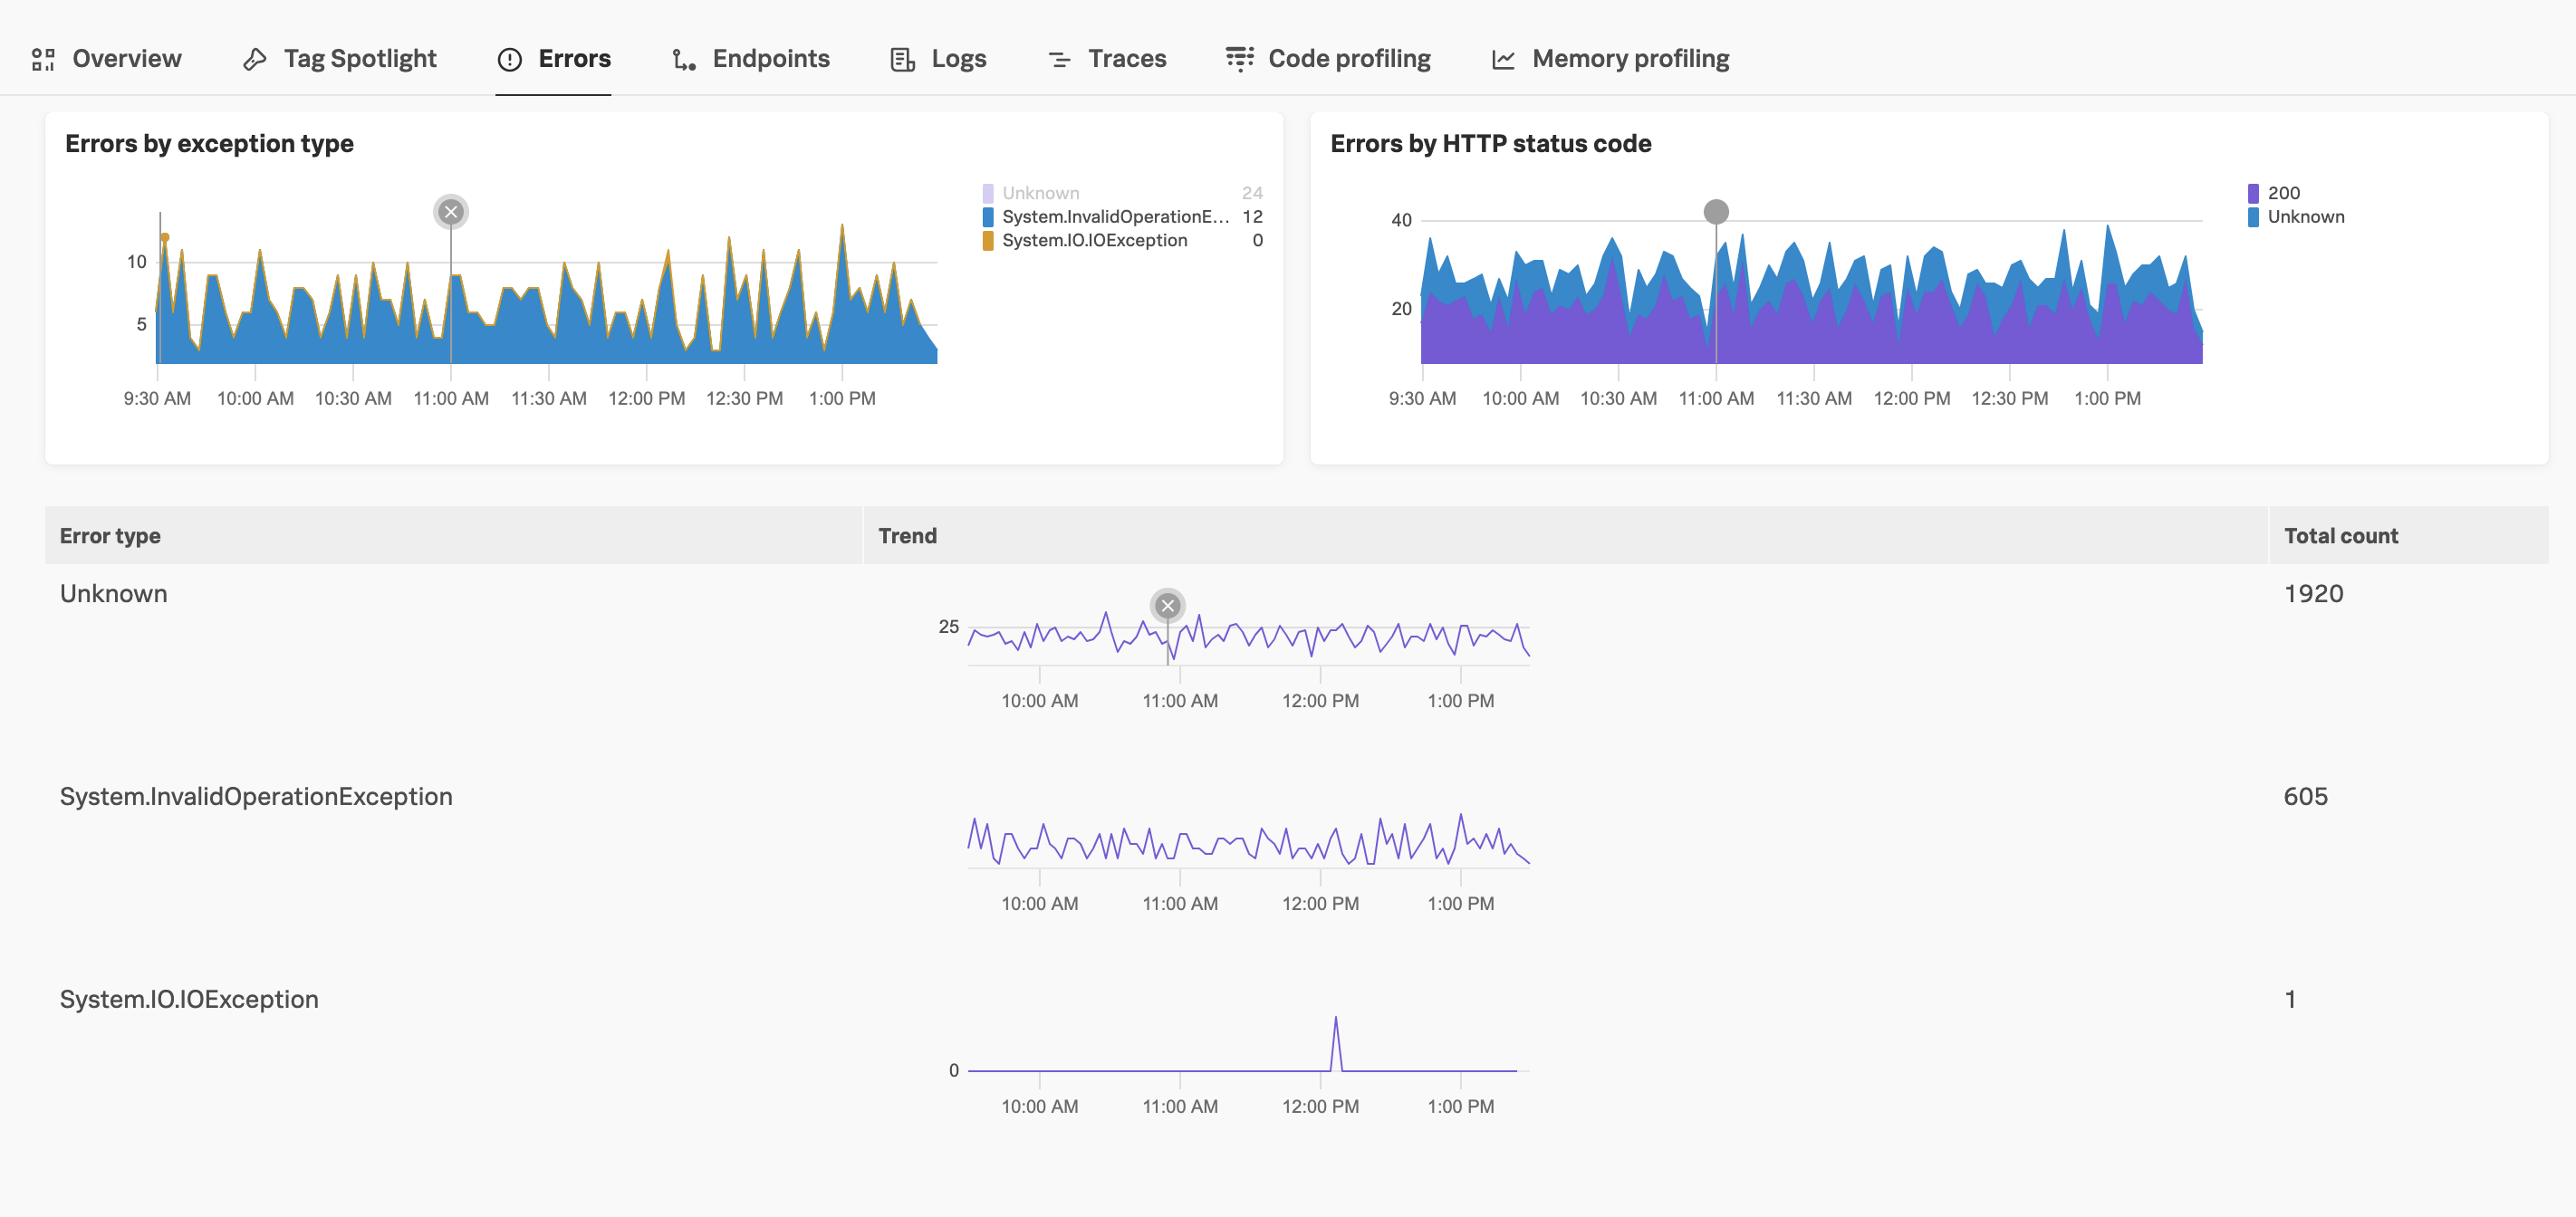
View errors for your service 🔗
Select the Errors tab to visualize errors for your service. Select a specific error type to view available traces for that error, and troubleshoot by viewing details such as the exception.message or exception.stacktrace.
Administrators can pause these metrics by going to the Sources of Errors MetricSets section on the APM MetricSets page and selecting Pause Indexing. These metrics are turned on by default.
View endpoints for your service 🔗
Select the Endpoints tab to view endpoints for the service. Use the search field to search for specific endpoints. Use the sort drop-down list to change how endpoints are sorted. Select an endpoint to view endpoint details or go to Tag Spotlight, traces, code profiling, or the dashboard for the endpoint.
View logs for your service 🔗
Select Logs to view logs for the environment and service you are viewing. By default, logs are displayed for all indices that correspond to first listed Log Observer Connect connection. Logs are filtered by the service you are viewing using the service.name value. If your logs do not have a service.name value, you can create an alias in Splunk Web. See Create field aliases in Splunk Web .
To select a different connection or refine which indices logs are pulled from, select Configure service view.
In the Log Observer Connect Index drop-down list, select the Log Observer Connect connection, then select the corresponding indices you want to pull logs from.
Select Apply
Select Save changes.
The connection and indices you select are saved for all users in your organization for each unique service and environment combination.
View traces for your service 🔗
Select Traces to view traces for the environment and service you are viewing. The Traces tab includes charts for Service requests and errors and Service latency. Select within the charts to see example traces.
Under the charts are lists of Traces with errors and Long traces. Select the trace ID link to open the trace in trace waterfall view. Select View more in Trace Analyzer to search additional traces. See Explore your traces using Trace Analyzer in Splunk APM for more information about using Trace Analyzer to search traces.
View top commands or queries for your databases 🔗
If you select a Redis or SQL database from the service dropdown menu, you can select Database Query Performance to view top commands or queries for your database. See Monitor Database Query Performance to learn more.
Go to the code profiling view for your service 🔗
Select Code profiling to go to the code profiling view of AlwaysOn Profiling filtered for your service. See Introduction to AlwaysOn Profiling for Splunk APM to learn more about AlwaysOn Profiling.
Go to the memory profiling view for your service 🔗
Select Memory profiling to go to the memory profiling view of AlwaysOn Profiling filtered for your service. See Introduction to AlwaysOn Profiling for Splunk APM to learn more about AlwaysOn Profiling.
Configure the service view 🔗
Select Configure service view to modify the Log Observer Connect connection and indices for the logs you want to display for your service.
In the Log Observer Connect Index drop-down list, select the Log Observer Connect connection, then select the corresponding indices you want to pull logs from.
Select Apply
Select Save changes.
The connection and indices you select are saved for all users in your organization for each unique service and environment combination.
Service view support for various service types 🔗
The information available in your service view varies based on the type of service you select. The following table shows which sections are available for each service type.
Service view section |
Instrumented services |
Databases |
Pub/sub queues |
Inferred services |
|---|---|---|---|---|
Overview |
Yes, includes service metrics, runtime metrics, and infrastructure metrics |
Yes, includes only service metrics |
Yes, includes only service metrics |
Yes, includes only service metrics |
Tag Spotlight |
Yes |
Yes |
Yes |
Yes |
Endpoints |
Yes |
No |
No |
Yes |
Logs |
Yes |
Yes |
Yes |
Yes |
Traces |
Yes |
Yes |
Yes |
Yes |
Database Query Performance |
No |
Yes, only displays for Redis and SQL databases. |
No |
No |
Code profiling |
Yes |
No |
No |
No |
Memory profiling |
Yes |
No |
No |
No |
Metric reference 🔗
The following metrics are used in the service view.
Service metrics 🔗
Chart |
Metrics |
|---|---|
Service requests |
|
Service latency |
|
Service errors |
|
SLI/SLO |
|
.NET runtime metrics 🔗
Chart |
Metrics |
|---|---|
Heap usage |
|
GC collections |
|
Application activity |
|
GC heap size |
|
GC pause time |
|
Monitor lock contention |
|
Threadpool thread |
|
Exceptions |
|
Java runtime metrics 🔗
Charts |
Metrics |
|---|---|
Memory usage |
|
Allocation rate |
|
Class loading |
|
GC activity |
|
GC overhead |
|
Thread count |
|
Thread pools |
|
Node.js runtime metrics 🔗
Charts |
Metrics |
|---|---|
Heap usage |
|
Resident set size |
|
GC activity |
|
Event loop lag |
|
Infrastructure metrics 🔗
Chart |
Metrics |
|---|---|
Host CPU usage |
|
Host memory usage |
|
Host disk usage |
|
Host network usage |
|
Pod CPU usage |
|
Pod memory usage |
|
Pod disk usage |
|
Pod network utilization |
|