Respond to incidents 🔗
You can drill down to find the root cause of incidents using several tools available in Splunk Observability Cloud. In the following sections, see how each component of Splunk Observability Cloud is an effective incident response tool.
For a better understanding of how you can use Splunk Observability Cloud with other Splunk platform products, see Splunk Observability Cloud and the Splunk platform scenarios for sample use cases.
Alerts and detectors 🔗
Use Splunk Observability Cloud alerts, detectors, events, and notifications to inform you when certain criteria are met. Alerts and detectors are often your first awareness that an incident has occurred. Splunk Observability Cloud has AutoDetect, or built-in alerts and detectors for supported integrations. See AutoDetect for more information.
Additionally, your team can create detectors to alert on performance and thresholds that matter most to you. For example, you can use alerts and detectors to notify your teams when your systems are nearing a limit you set in an SLO, such as approaching a server latency that is too high. For information on alerts, detectors, thresholds, and how they interact, see Introduction to alerts and detectors in Splunk Observability Cloud.
When you proactively use alerts and detectors to stay informed on changes in your systems, you can decrease the number of incidents your users experience and reduce toil for your teams in the future by updating your systems when events surpass a static or dynamic threshold that you set.
You can see all alerts, including AutoDetect alerts and custom alerts, on the Alerts homepage in Splunk Observability Cloud. To go to your organization’s Alerts homepage, log in to Splunk Observability Cloud, then select Alerts in the left navigation menu. The following screenshot shows your Alerts homepage.
AutoDetect enables Splunk Observability Cloud’s automatic detectors for supported integrations. You can subscribe to notifications for all integrations after you connect your systems and send in data for supported integrations. See Use and customize AutoDetect alerts and detectors to learn more. See also List of available AutoDetect detectors.
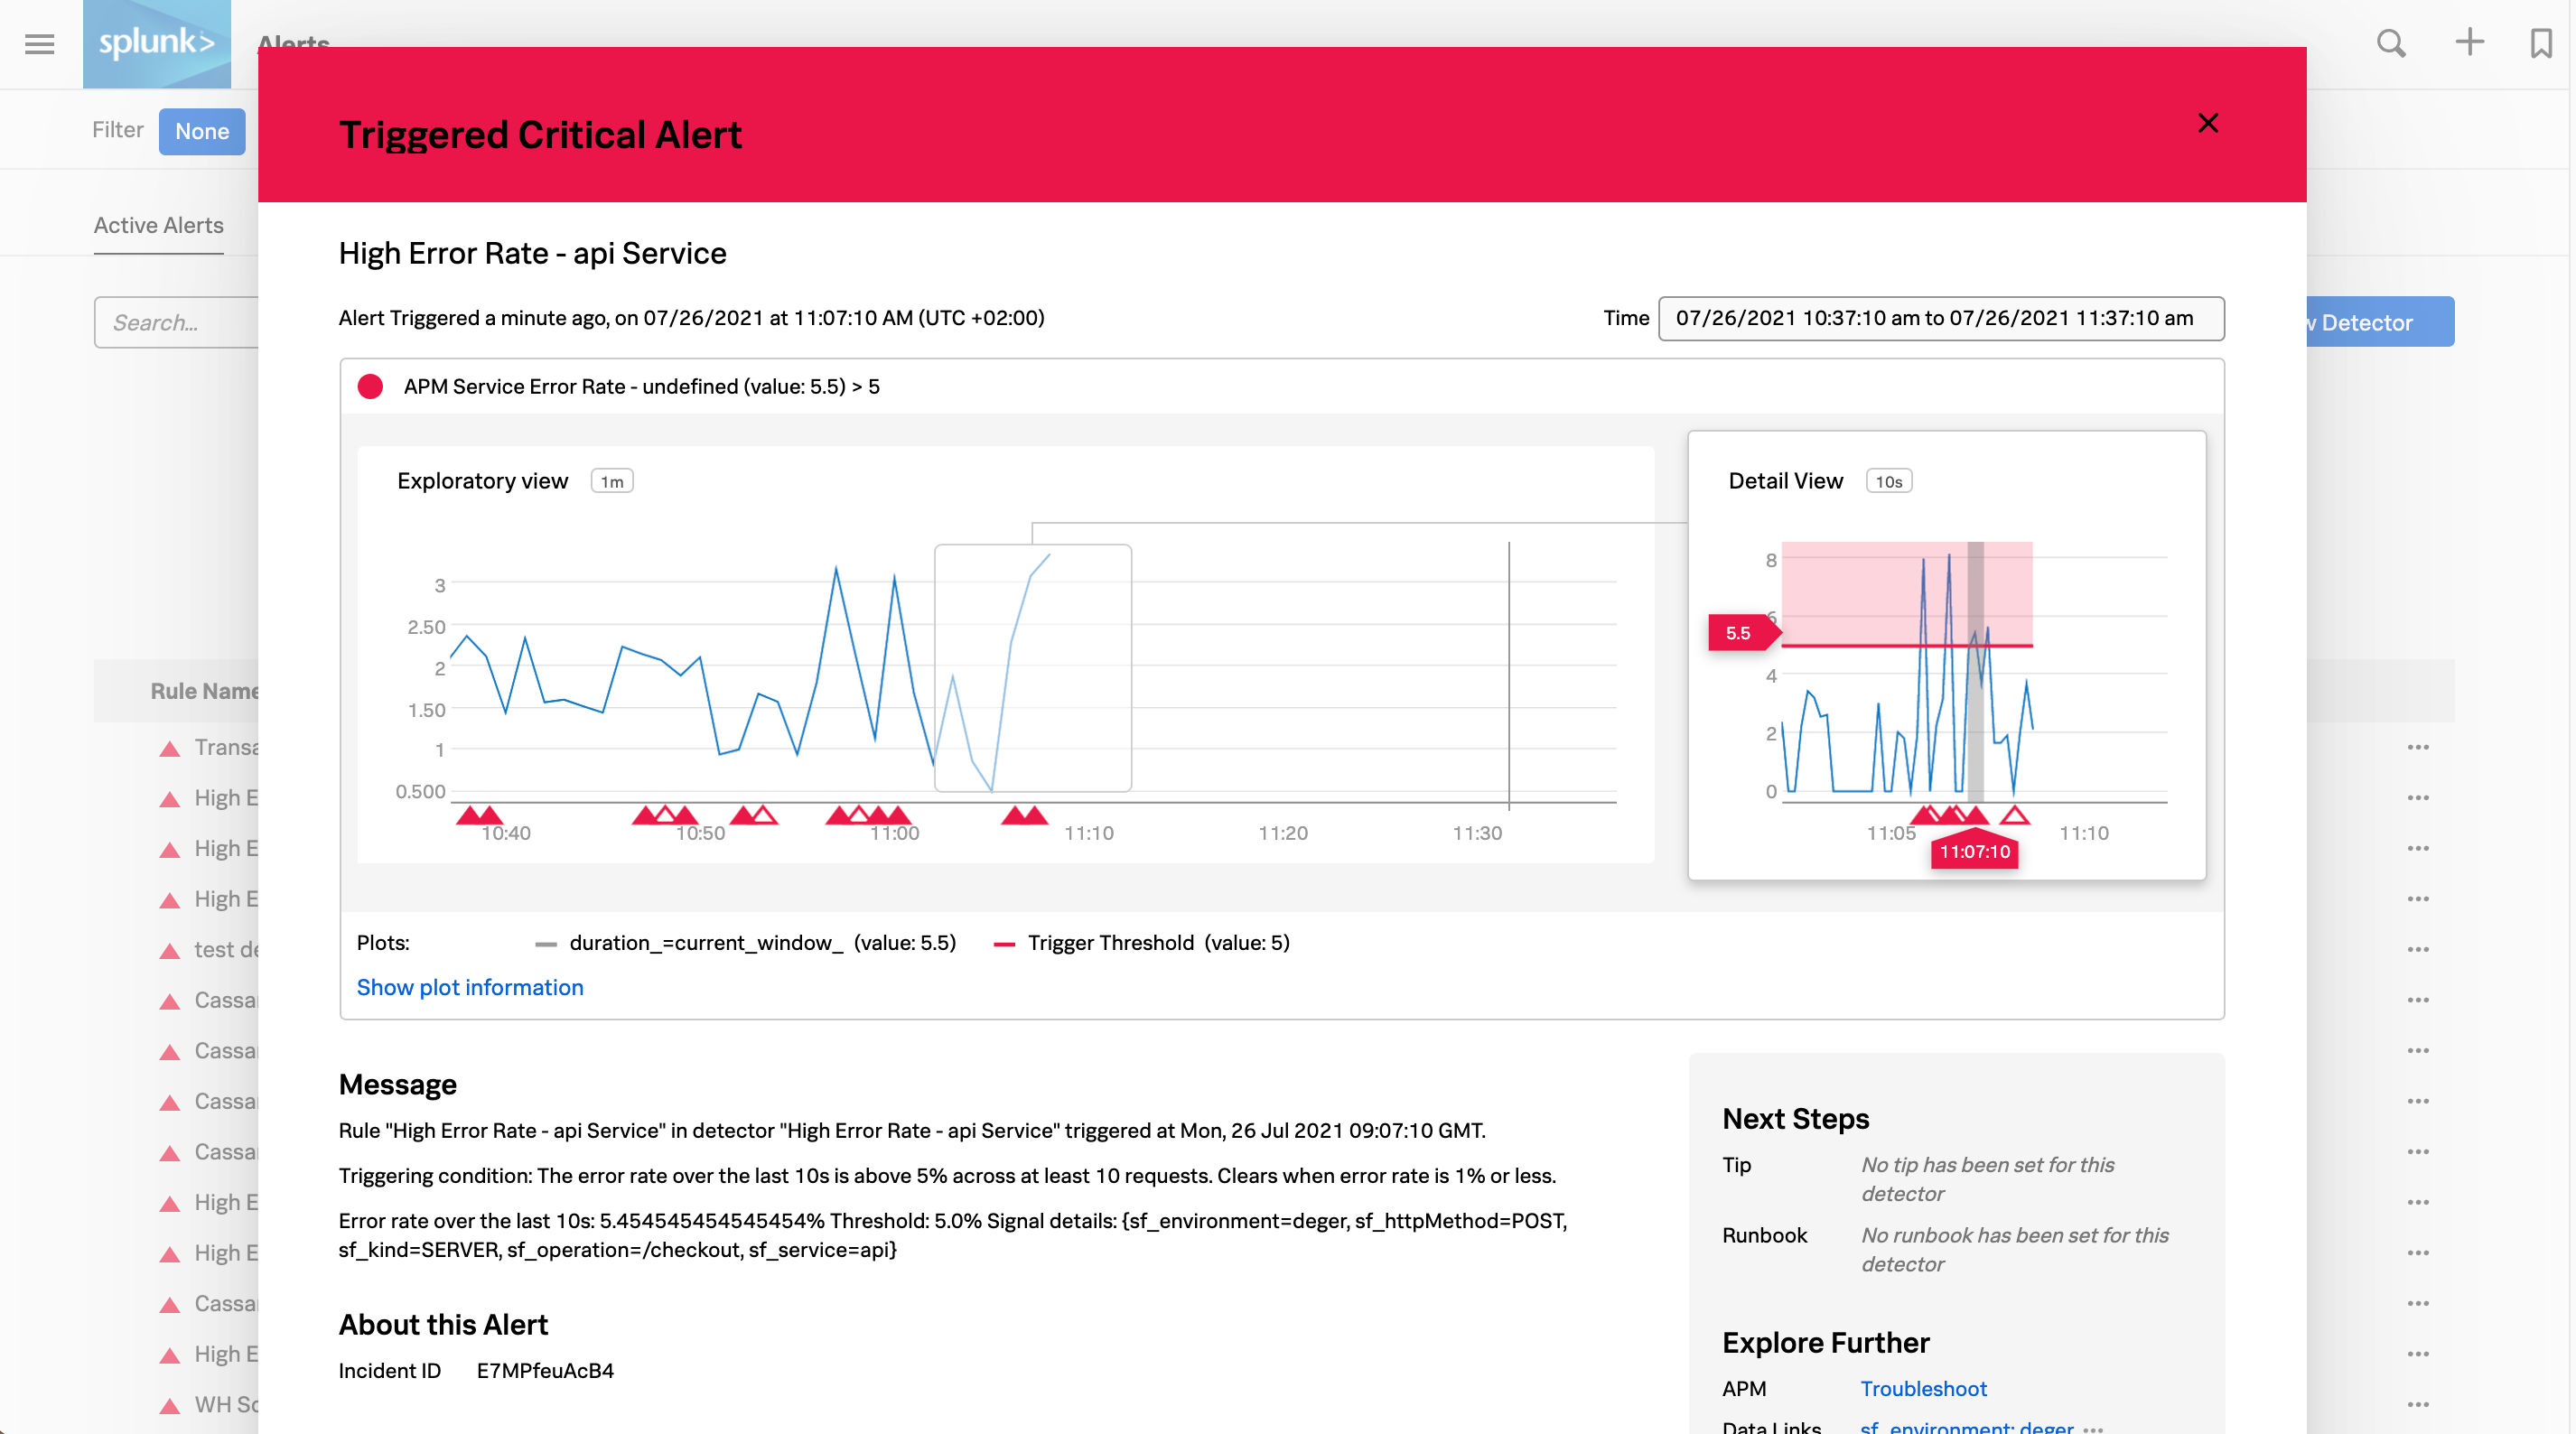
Select any alert to see details and links to Splunk Observability Cloud components that you can use to troubleshoot the error. The following critical alert shows a high API error rate. The Explore Further section on the right panel shows a link that takes you to APM where you can troubleshoot the issue.
See Scenarios for finding and resolving infrastructure problems using alerts and detectors for examples of how you can use alerts to notify teams about increased server latency, high CPU usage, approaching system limits, and other conditions that negatively impact user experience.
Dashboards 🔗
Splunk Observability Cloud components all contribute to the data analytics in Splunk Observability Cloud dashboards. You can see charts and dashboards in APM, Infrastructure Monitoring, and RUM. You can also go to the homepage for all Splunk Observability Cloud dashboards to see dashboards and charts created in each component, including log views or logs data displayed in a chart.
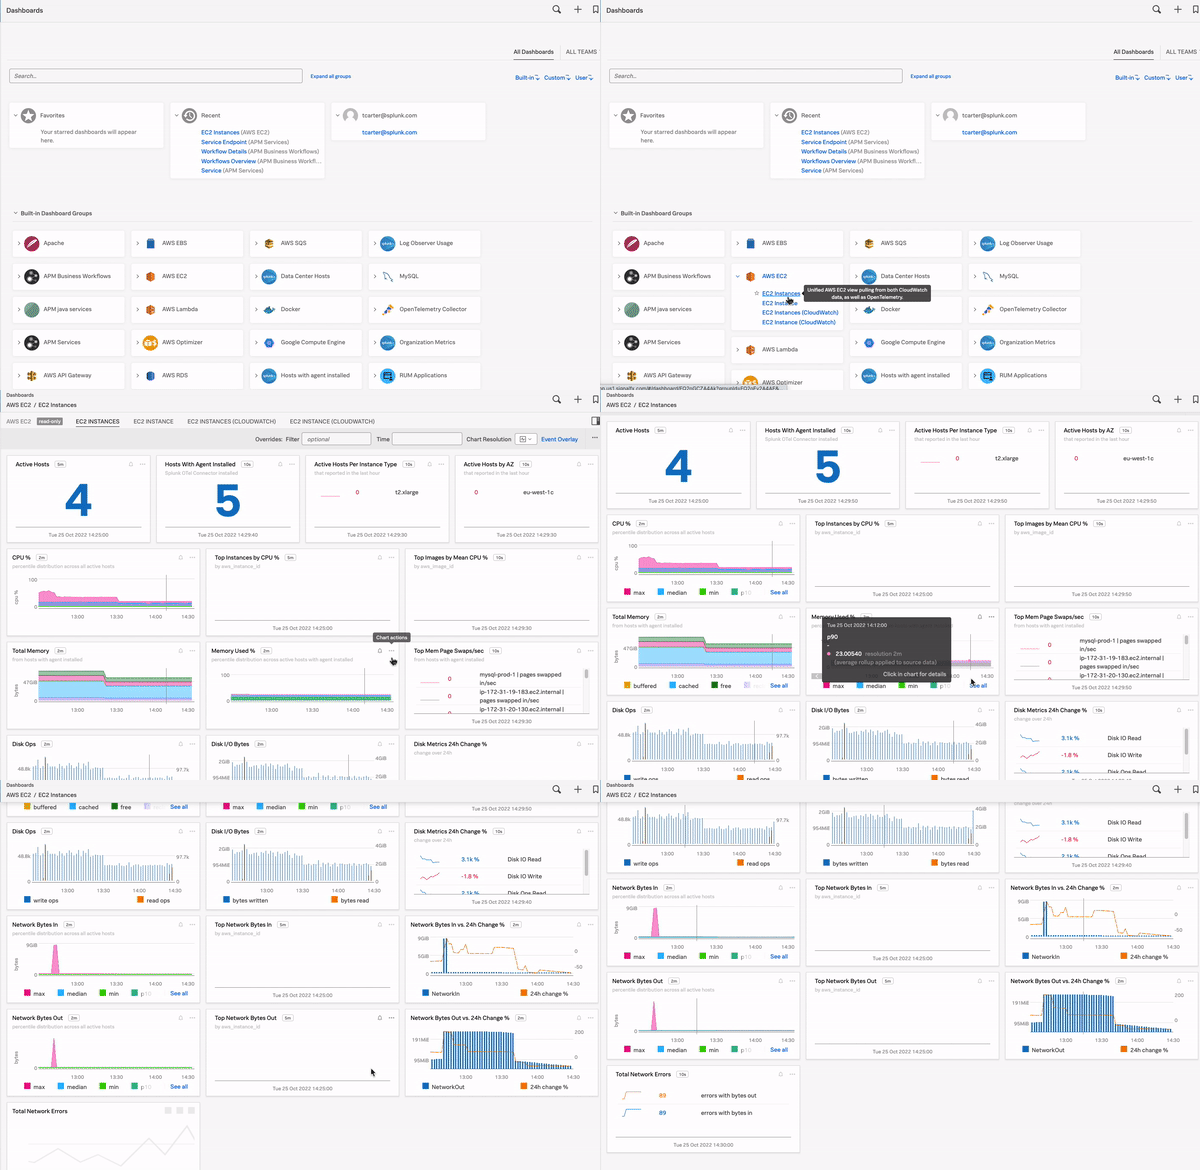
Splunk Observability Cloud has built-in dashboards, custom dashboards, user dashboards, and dashboard groups. See Dashboard and dashboard group types in Splunk Observability Cloud for more information. See also built-in dashboards to learn more about built-in dashboards. Dashboards contain important information that can provide useful and actionable insight into your system at a glance. You can create custom dashboards and charts that help you monitor your SLOs, or simple dashboards that contain only a few charts that drill down into the data that you want to see. The following example shows a dashboard for an organization with dozens of built-in dashboards reporting on their many supported integrations. When users select a dashboard, they see all charts saved to this dashboard and can quickly drill down on a chart showing interesting trends or unexpected variation.
To see your dashboards, log in to Splunk Observability Cloud and select Dashboards in the left navigation menu.
Splunk APM 🔗
APM collects traces and spans to monitor your distributed applications. You can investigate the root cause of an error with the service map or find the root cause of an error using Tag Spotlight. To learn how, see Scenario: Kai investigates the root cause of an error with the Splunk APM service map and Scenario: Deepu finds the root cause of an error using Tag Spotlight. For more examples of APM troubleshooting scenarios, see Scenarios for troubleshooting errors and monitoring application performance using Splunk APM.
Database Query Performance 🔗
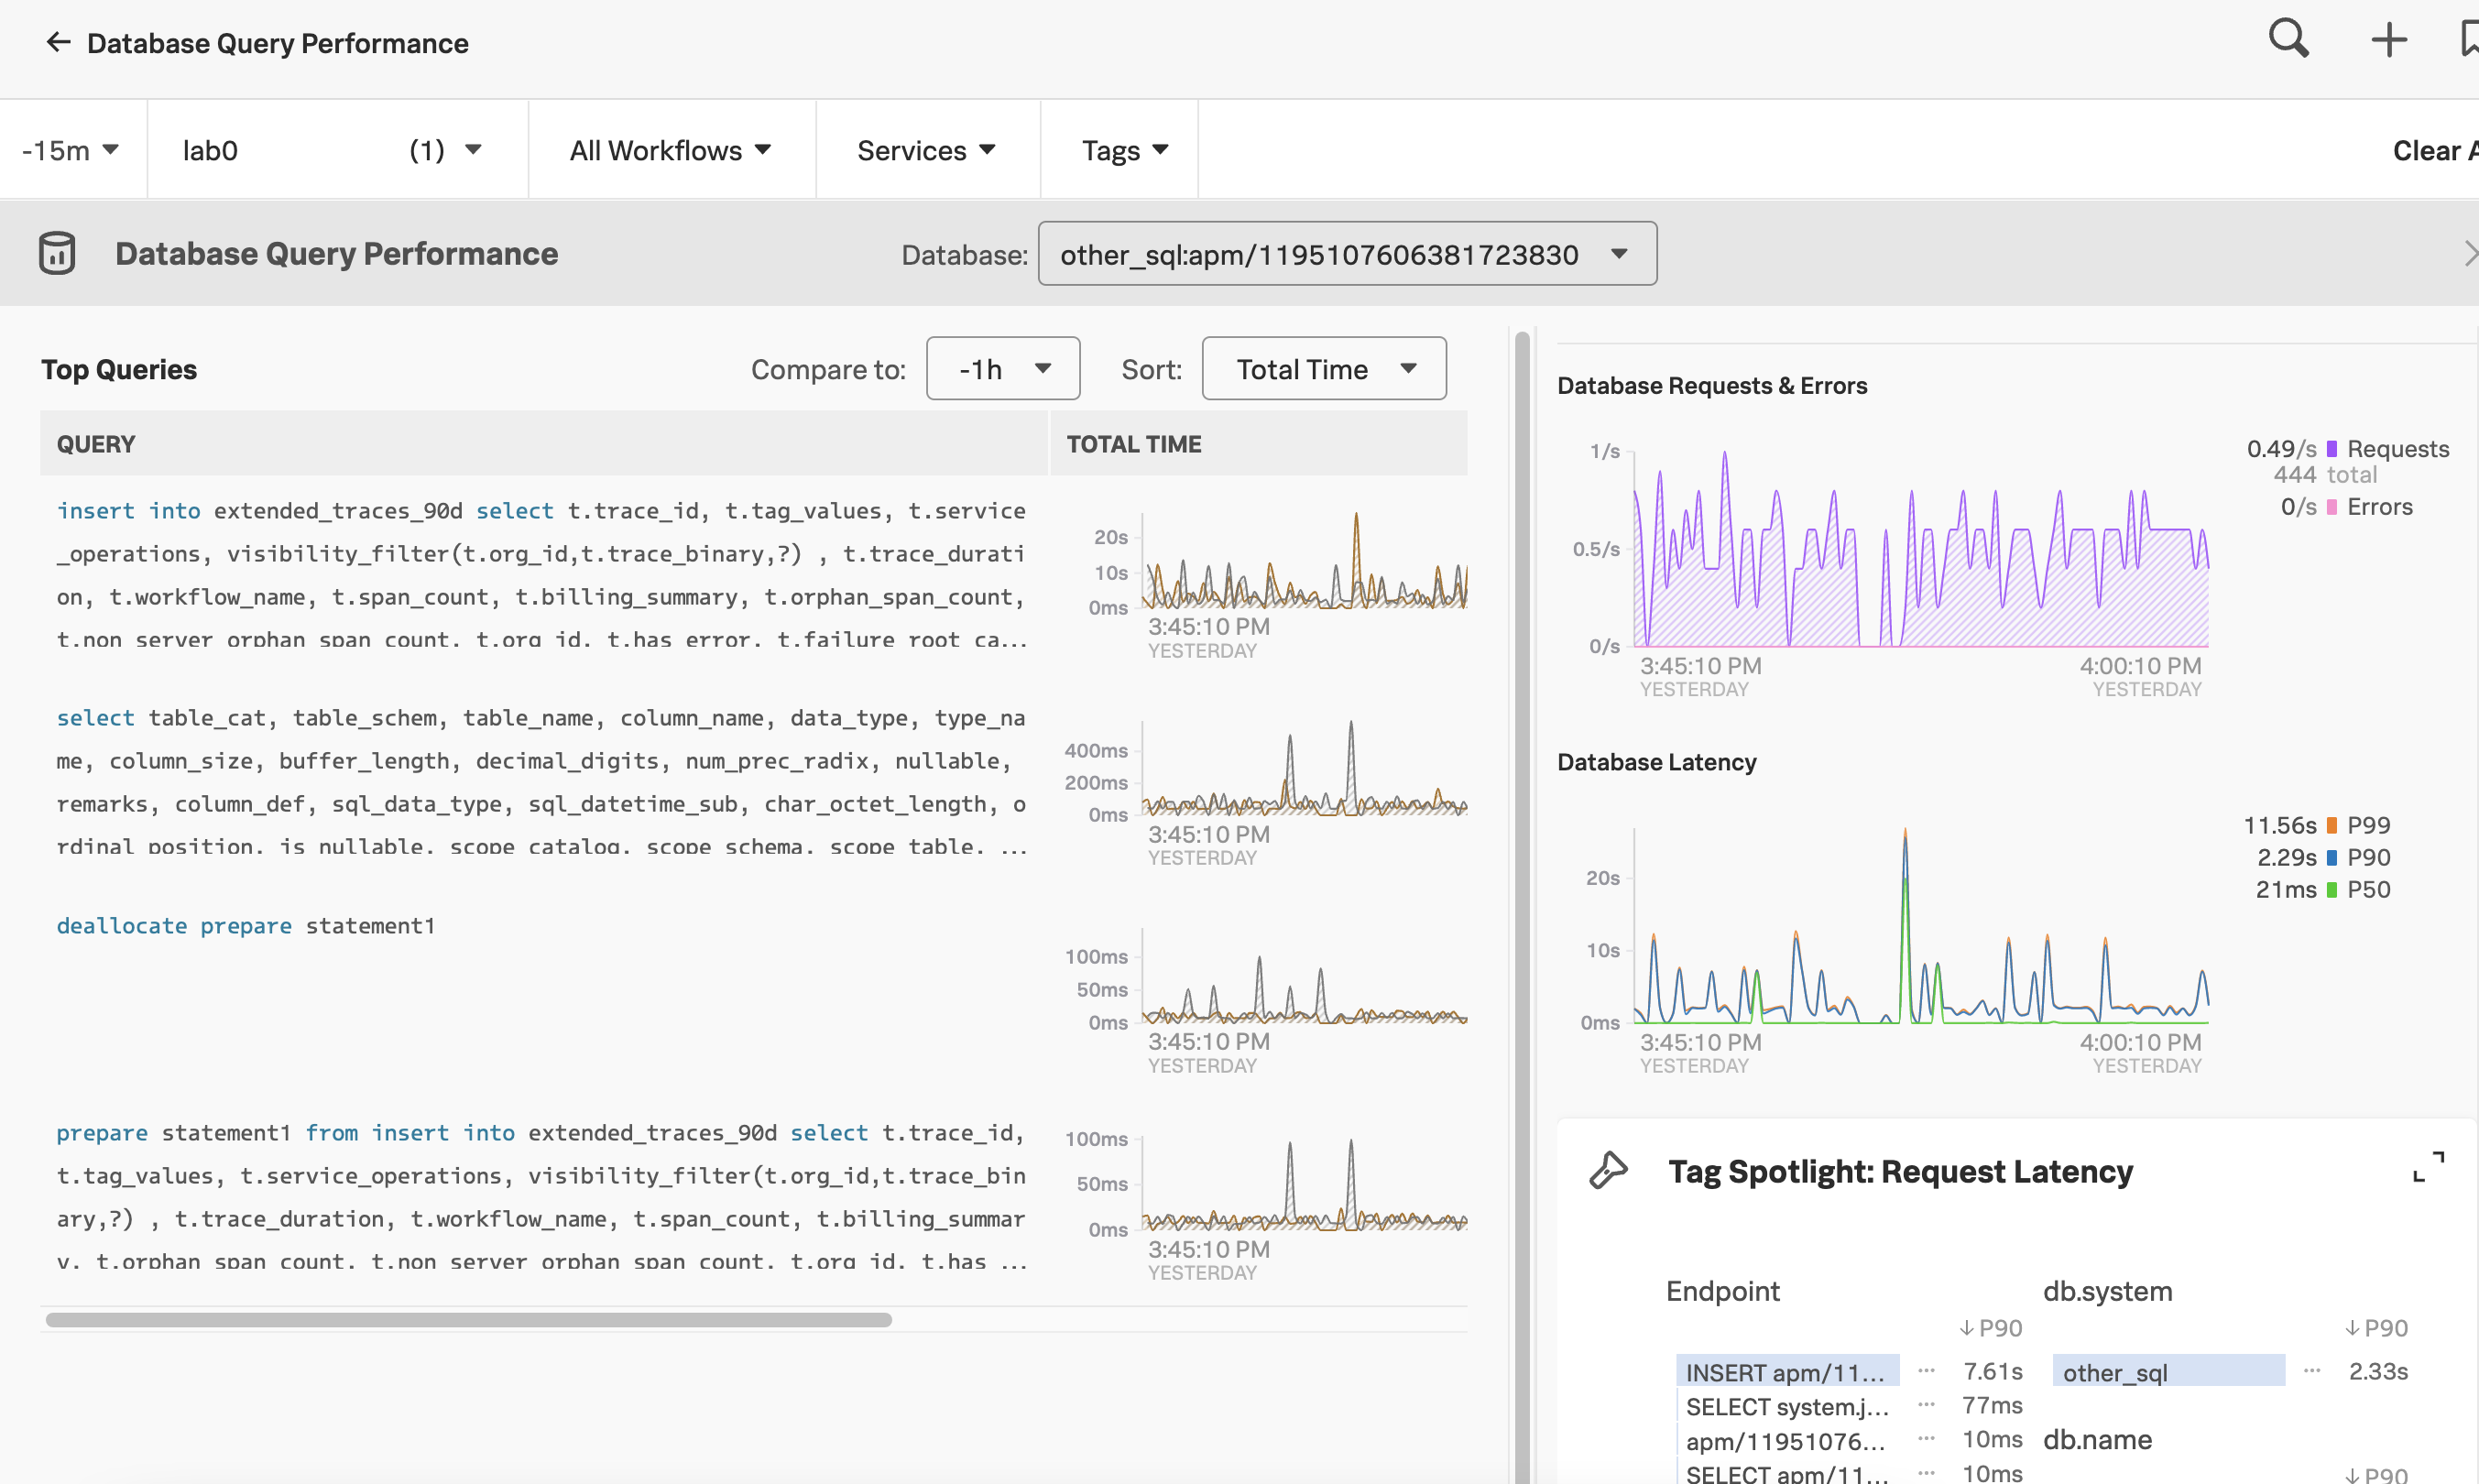
Slow database queries can be another culprit of wider service availability issues. Respond to incidents faster by assessing whether database query time is contributing to availability or latency incidents. See Monitor Database Query Performance to see how your databases are performing. The following image shows one organization’s Database Query Performance dashboard.
You can check the performance of your database queries in Splunk APM. Log in to Splunk Observability Cloud, select APM in the left navigation menu, then select DB Query Performance on the right panel.
Splunk Infrastructure Monitoring 🔗
Infrastructure Monitoring is an industry-leading custom metrics platform for real-time monitoring across infrastructure, application, and business metrics. See Use navigators in Splunk Infrastructure Monitoring to explore different layers of your deployments, including your public cloud services, containers, and hosts.
The Infrastructure Monitoring heat map shows the CPU, memory, disk, and network metrics of each host, container, and public cloud service in a real-time streaming fashion. You can sort by CPU utilization or select Find Outliers on the heat map to see which of your resources might be spiking in CPU usage, causing your users to experience slow load or save times.
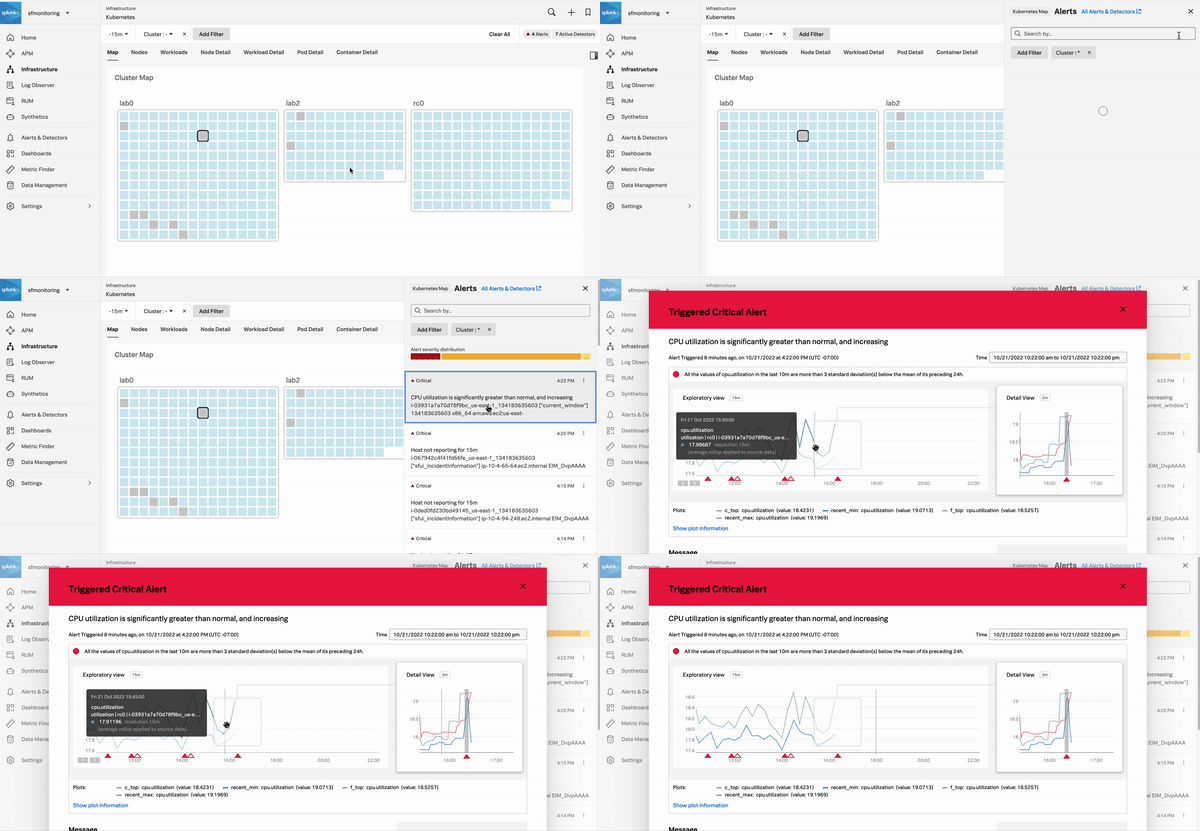
The following GIF shows an incident responder selecting a critical alert in Infrastructure Monitoring. The responder discovers that host CPU utilization is outside of expected norms set by a Splunk Observability Cloud admin. Teams responding to an incident can use this information to remediate the problem with the host or rebalance resources and prevent users from experiencing higher than expected latency.
See Monitor services and hosts in Splunk Infrastructure Monitoring to learn more about using Infrastructure Monitoring navigators to monitor public clouds, containers, or hosts.
Splunk Log Observer Connect 🔗
Use Log Observer Connect to drill down to the root cause of incidents in the lowest mean time to resolution. While Splunk core platform users already have access to a powerful logging tool, Log Observer Connect provides an intuitive, codeless, in-app search tool that anyone can use without knowing a query language. Additionally, Log Observer Connect does not require importing logs into Splunk Observability Cloud. Logs remain securely in your Splunk Cloud Platform or Splunk Enterprise instance, while you can observe them from Splunk Observability Cloud and correlate your Splunk platform logs with metrics, traces, and user experience to drill down to root cause problems faster.
With Log Observer Connect, you can aggregate logs to group by interesting fields. You can also filter logs by field, view individual log details, and create field aliases to drill down to the root cause of an incident. To learn more, see the following pages:
To view related content, select correlated infrastructure resources, metrics, or traces in the Related Content bar. See Related Content in Splunk Observability Cloud to learn more. Seeing your logs data correlated with metrics and traces in Splunk Observability Cloud helps your team to locate and resolve problems faster.
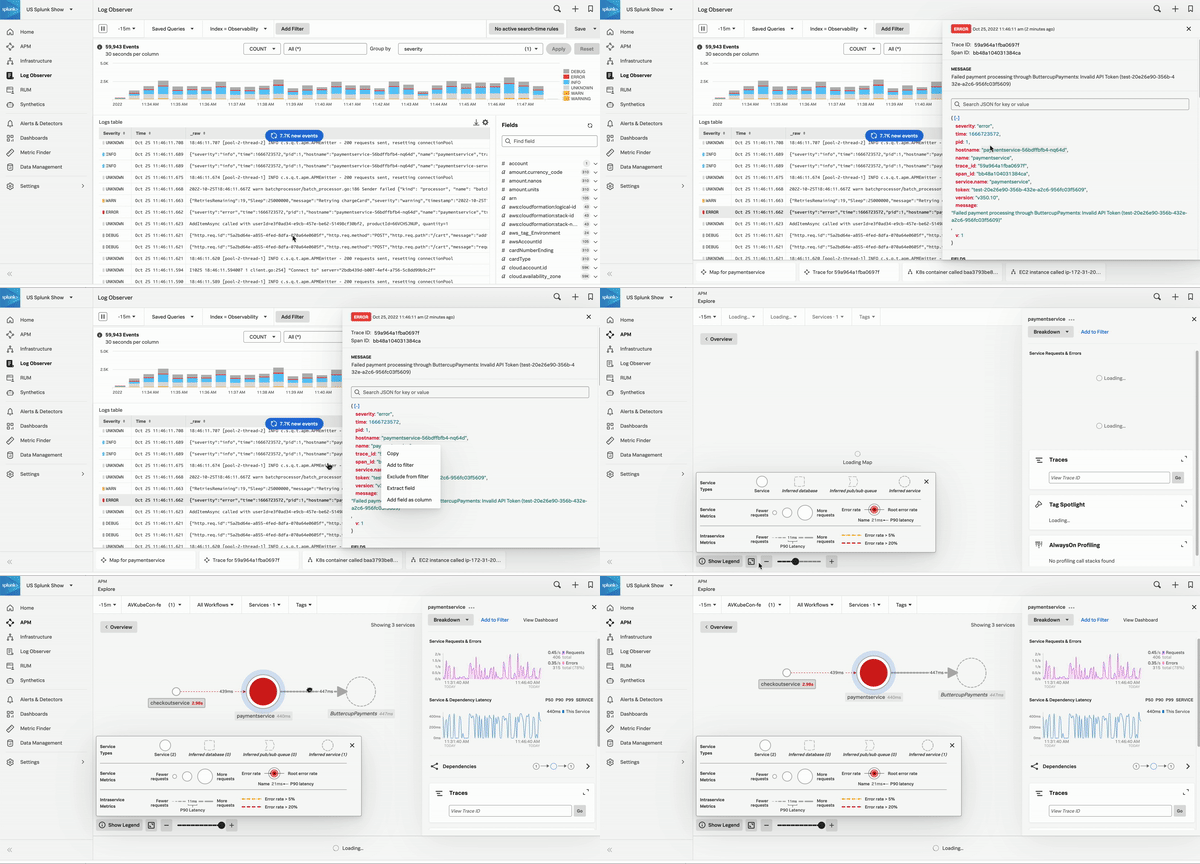
The following GIF shows an incident responder selecting an error log in Log Observer Connect, then selecting related content to see a problematic host. This takes the user to the service map in Infrastructure Monitoring where the problematic host is automatically selected. The service map panel shows service requests and errors, as well as service and dependency latency for the selected host.
See Query logs in Log Observer Connect to learn all of the ways Log Observer Connect queries can drill down to root causes of incidents.
Real User Monitoring (RUM) 🔗
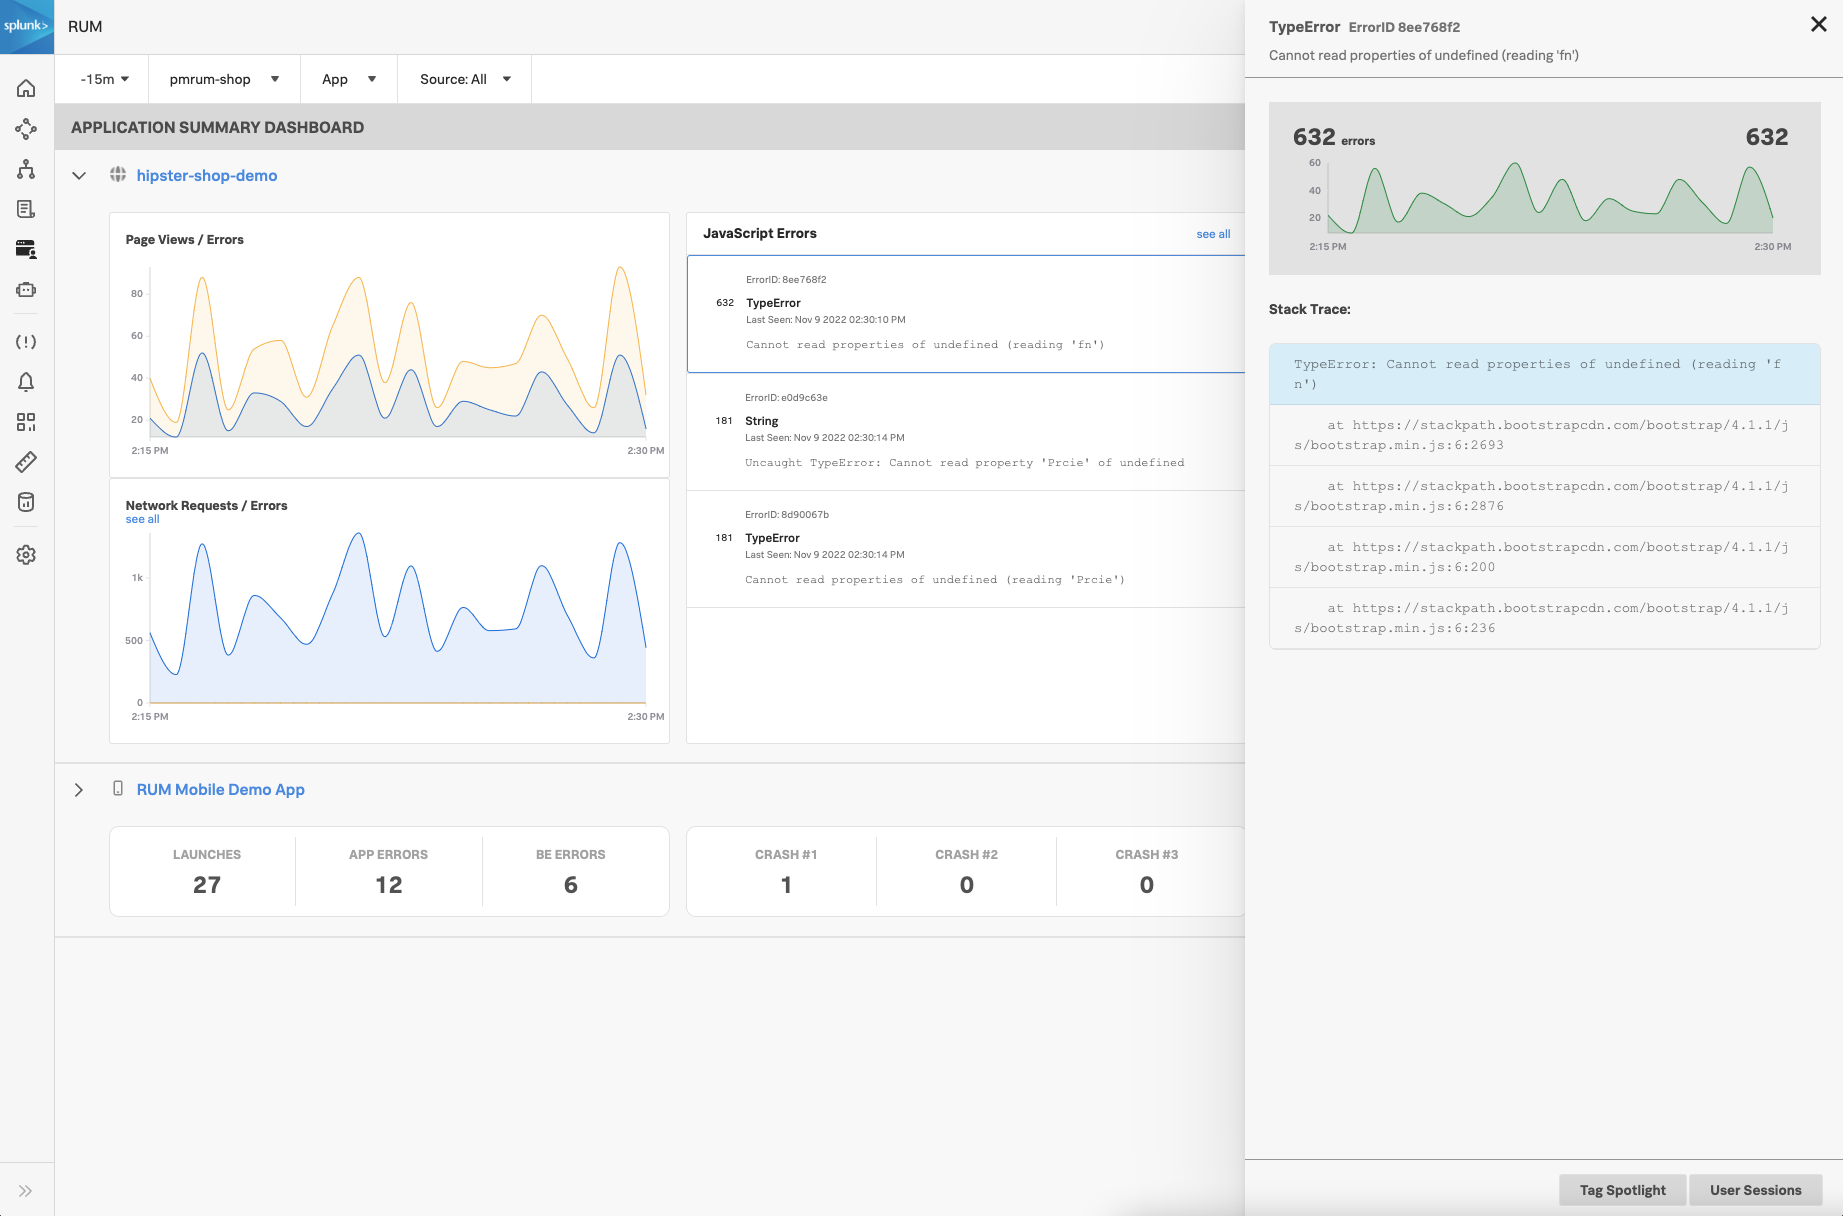
RUM monitors the user experience in your application UI by analyzing user sessions. In RUM, you can monitor and drill down on front-end JavaScript errors and network errors.
You can look for front-end and back-end errors, as well as see resource errors and resource response times. See Identify errors in browser spans to walk through a scenario that shows you how to find JavaScript errors, back-end errors, and long resource response times.
RUM is particularly helpful when investigating the root cause of an error reported by a user. See Scenario: Kai finds the root cause of a user-reported error in Splunk RUM for Mobile to learn more.

