Measure and alert on SLIs 🔗
Splunk Observability Cloud provides prepackaged solutions for monitoring your service level indicators (SLIs) and service level objectives (SLOs). You can also define your own signals with custom detectors and alert on the data most important to your teams.
For a better understanding of how you can use Splunk Observability Cloud with other Splunk platform products, see Splunk Observability Cloud and the Splunk platform scenarios for sample use cases.
SLIs and SLOs 🔗
SLIs are important because they help you meet your SLAs with customers. SLIs are the metrics used to measure your system’s availability. Service level objectives (SLOs) are what you determine is the appropriate level of availability, as measured by your SLIs. Service level agreements (SLAs) are the promise you make to your customers about how much of the time you will meet your SLOs and what you will do if you do not meet them.
The following example shows an SLI of system availability with an appropriate SLO and SLA for your customers:
SLI: The percentage of the time your system is available, where you define availability as a transaction taking less than a half second to complete.
SLO: Your system aims to be available 99.99% of the time.
SLA: If your system is not available 99.99% of the time during a month, you give the customer a rebate.
To meet your business goals, you must set and manage SLOs based on accurate data, as measured by your SLIs. Splunk Observability Cloud immediately monitors and analyzes your SLIs, takes the guesswork out of determining error budgets, and helps you set reasonable SLOs so that you meet your business goals. The following section introduces SLO management, a tool you can use to measure and alert on your SLIs and SLOs. The final section details multiple other ways you can use Splunk Observability Cloud to monitor important signals for your service.
Service level objective (SLO) management 🔗
Splunk Observability Cloud provides a service level monitoring experience that helps you align your business needs with your engineering reliability goals. Service level monitoring is the process of measuring, tracking, and analyzing a variety of service level indicators (SLIs) associated with a given service. You can then compare the health of a deployed software or service against your business goals. To learn more about SLO management and how to create your own SLO, see Introduction to service level objective (SLO) management in Splunk Observability Cloud.
Additional methods of monitoring your service 🔗
In addition to SLO management, there are many other ways to monitor important signals for your service so that you can remain aligned with your business goals. The following sections detail those methods.
Splunk APM 🔗
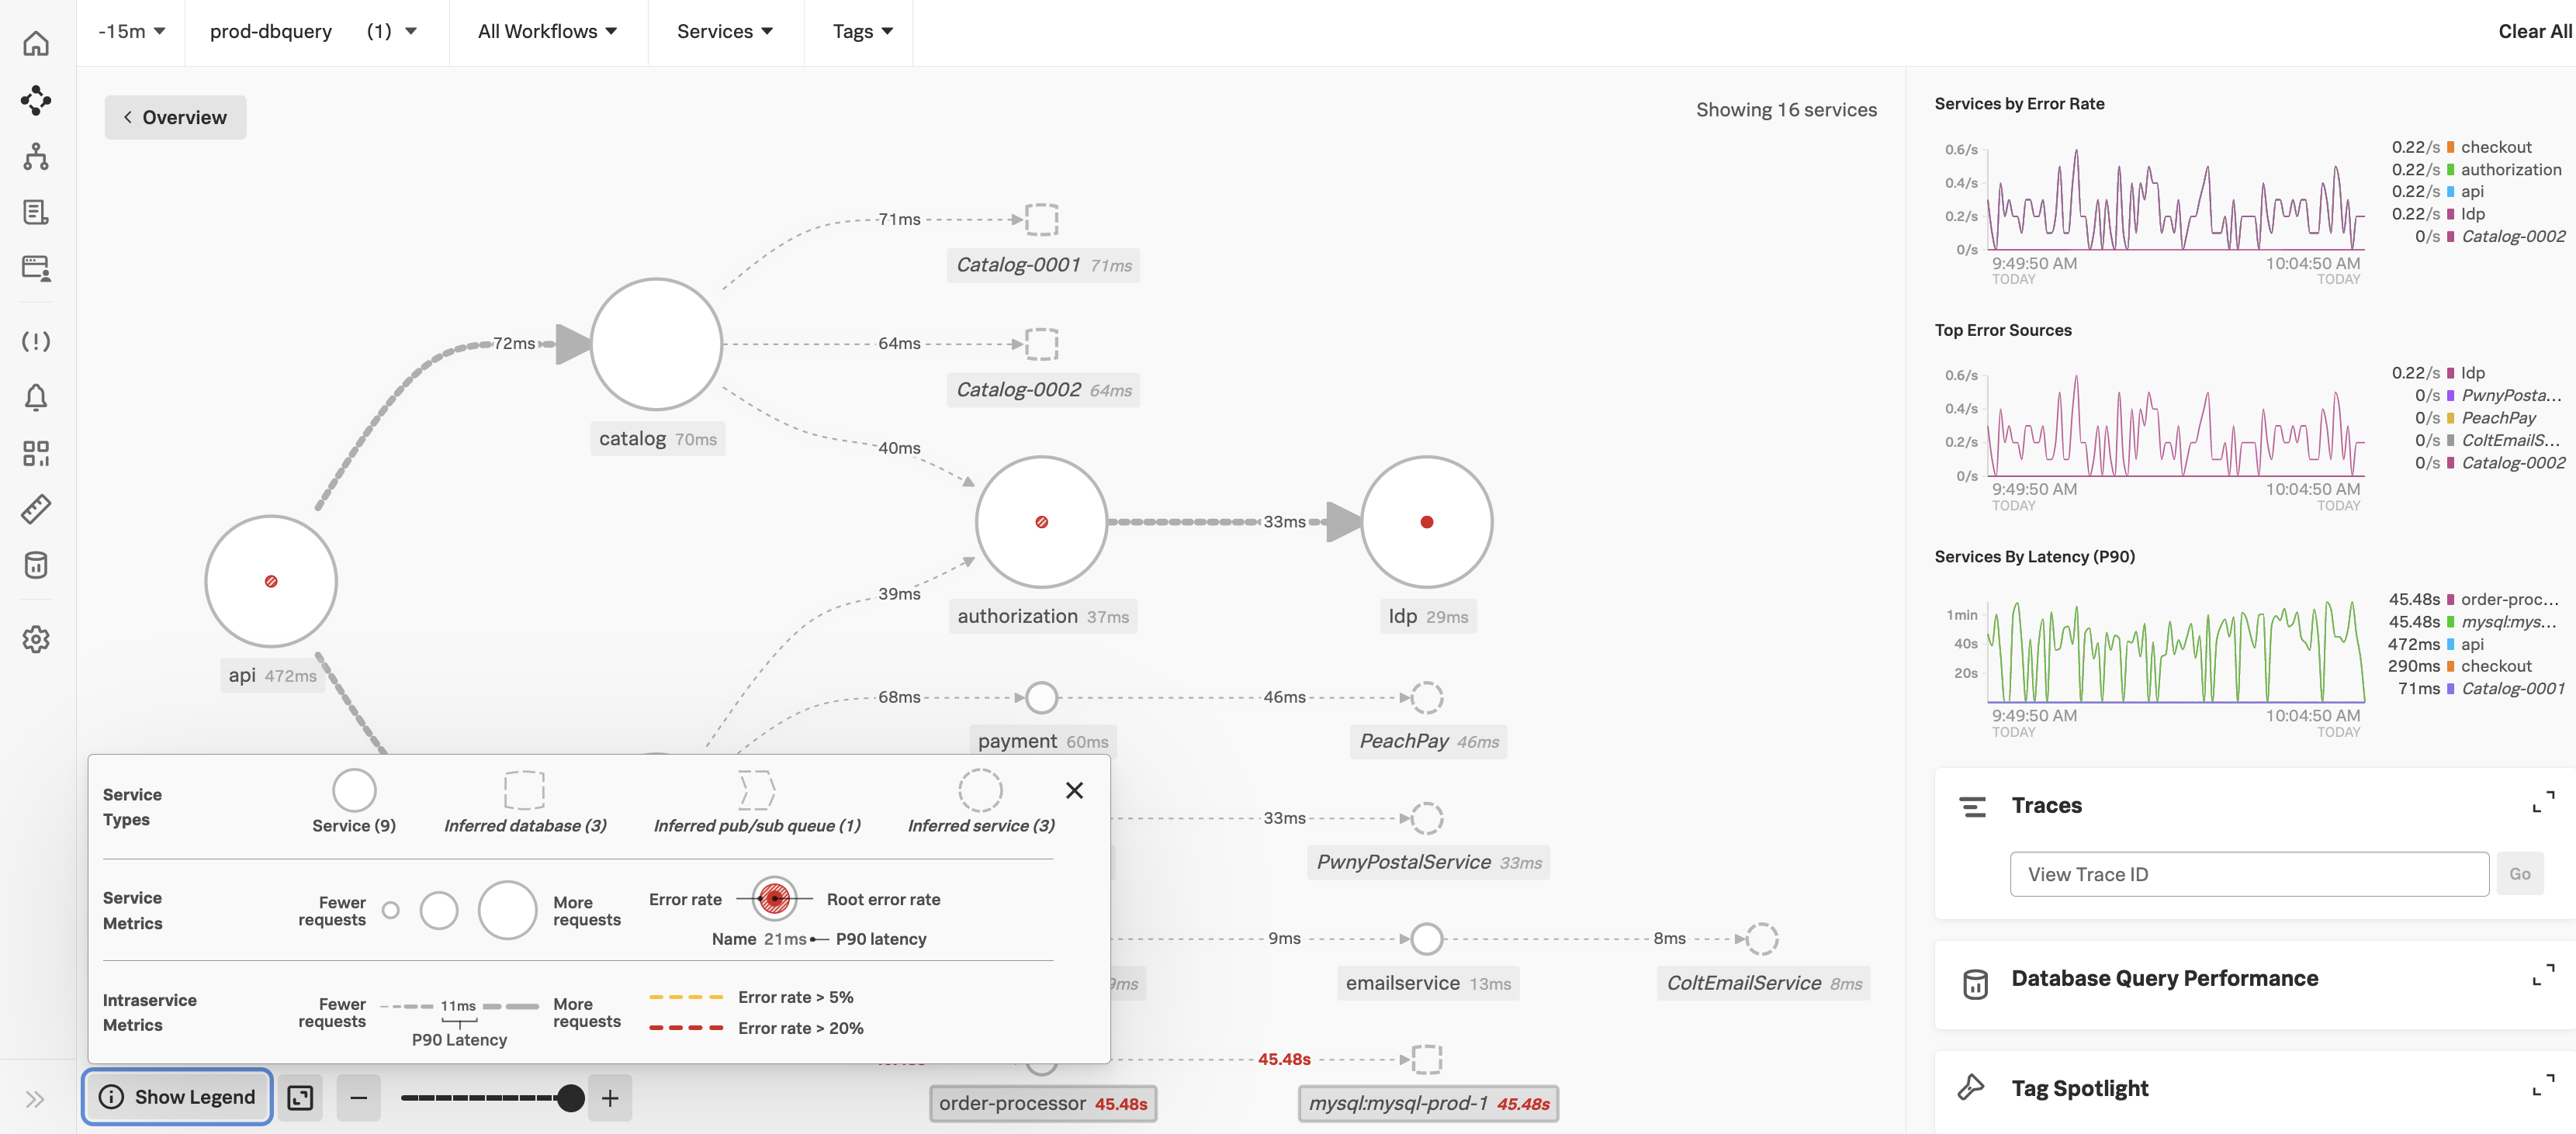
You can monitor important service signals in Splunk APM. Splunk APM automatically generates a service map displaying all of your instrumented and inferred services, the dependencies among them, and SLIs for each when you select a service. See View dependencies among your services in the service map. The service map shows signals for your services, including error rate, root error rate, and latency of your services. The panel to the right of the service map also shows services by error rate, top error sources, and services by latency. For example, you can track whether the signal for your 90th percentile service latency for each service is less than 5 seconds. On the following service map, you can see in the Services By Latency (P90) chart on the right that all services have a P90 of less than 1 minute. You can also track error rates on the service map in the Services by Error Rate chart.
You can alert on a service by creating a detector. See Create detectors to trigger alerts to learn how. You can also rely on built-in alert conditions and link detectors to charts. See built-in alert conditions and link detectors to charts.
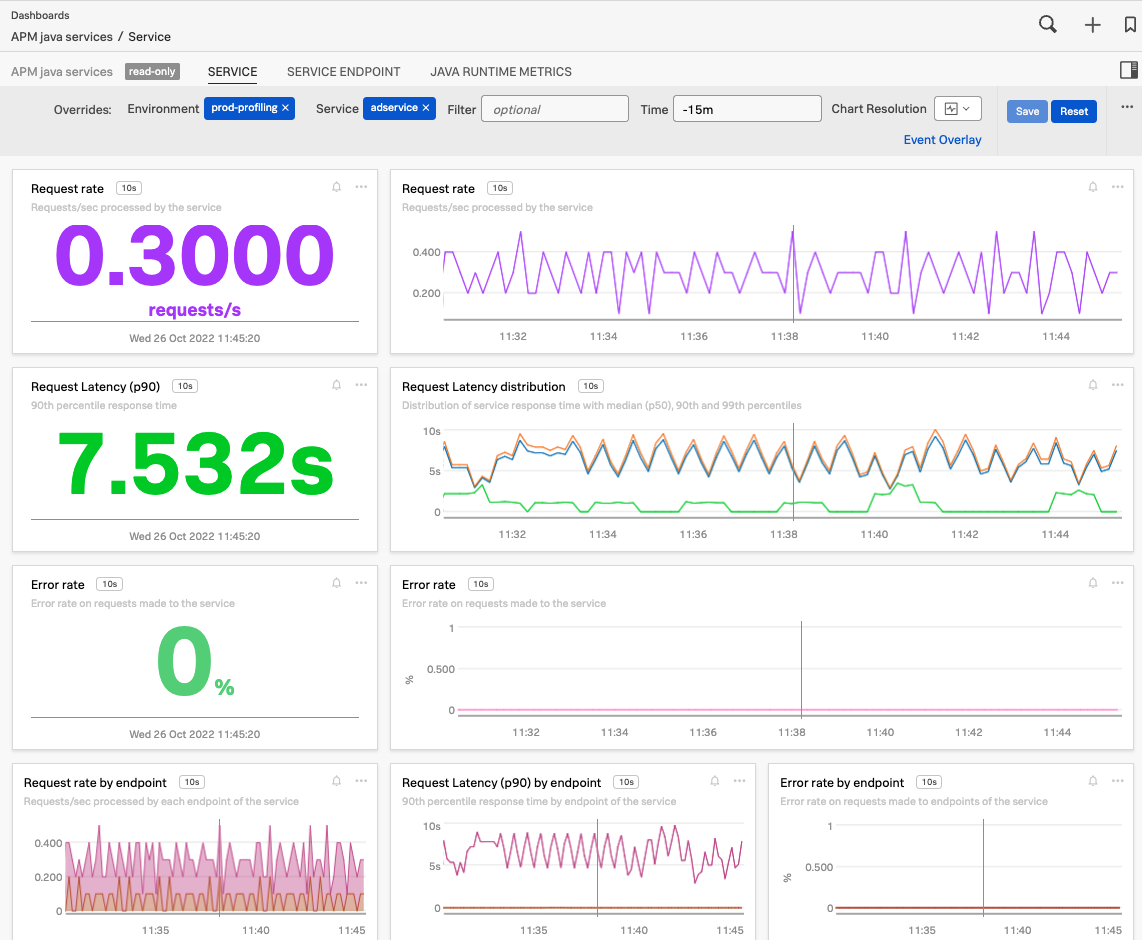
Built-in dashboards in Splunk APM are automatically populated with signals for all integrated services. See Built-in dashboards for more information. The following sample APM dashboard shows multiple signals: request rate, request latency, request latency distribution, and error rate
To see a dashboard for a service, select the service on the service map, then select View Dashboard.
See Dashboards in Splunk Observability Cloud for a list of dashboards and how you can create, customize, import, export, clone, and share them. See Track service performance using dashboards in Splunk APM to learn how to track performance, troubleshoot from the dashboard, and create a detector so that you can alert on a dashboard or chart in the future. For a scenario on managing SLOs using APM, see Scenario: Kai monitors detector service latency for a group of customers.
Splunk Observability Cloud Alerts and detectors 🔗
AutoDetect is a set of read-only alerts and detectors that Splunk Observability Cloud automatically creates when you configure supported integrations. As described in the previous section, you can also set up custom detectors to define your own signals and alert on any data that matters to you. See Use and customize AutoDetect alerts and detectors for more information.
Splunk Infrastructure Monitoring 🔗
Infrastructure Monitoring is a custom metrics platform for real-time monitoring across infrastructure, applications, and business metrics. It collects health and performance data from servers, virtual machines, containers, databases, public cloud services, container orchestration, and serverless and other back-end components in your deployment. With over 200 integrations and dashboards, you can monitor your entire infrastructure on a single screen and significantly speed your cloud migration journey.
Monitor signals in prepackaged navigators, such as the following navigator chart that shows latency over the last minute for AWS ELB instances:

In addition to prepackaged navigators, you can set up alerts and detectors on any custom Infrastructure Monitoring data that matters to you. See Introduction to alerts and detectors in Splunk Observability Cloud.
Virtual metrics in Splunk Infrastructure Monitoring help you measure signals by automatically gathering, aggregating, and defining metrics. Virtual metrics remove the complexity of choosing the most appropriate metric source among various available options. See Virtual metrics in Splunk Infrastructure Monitoring.
Real User Monitoring (RUM) 🔗
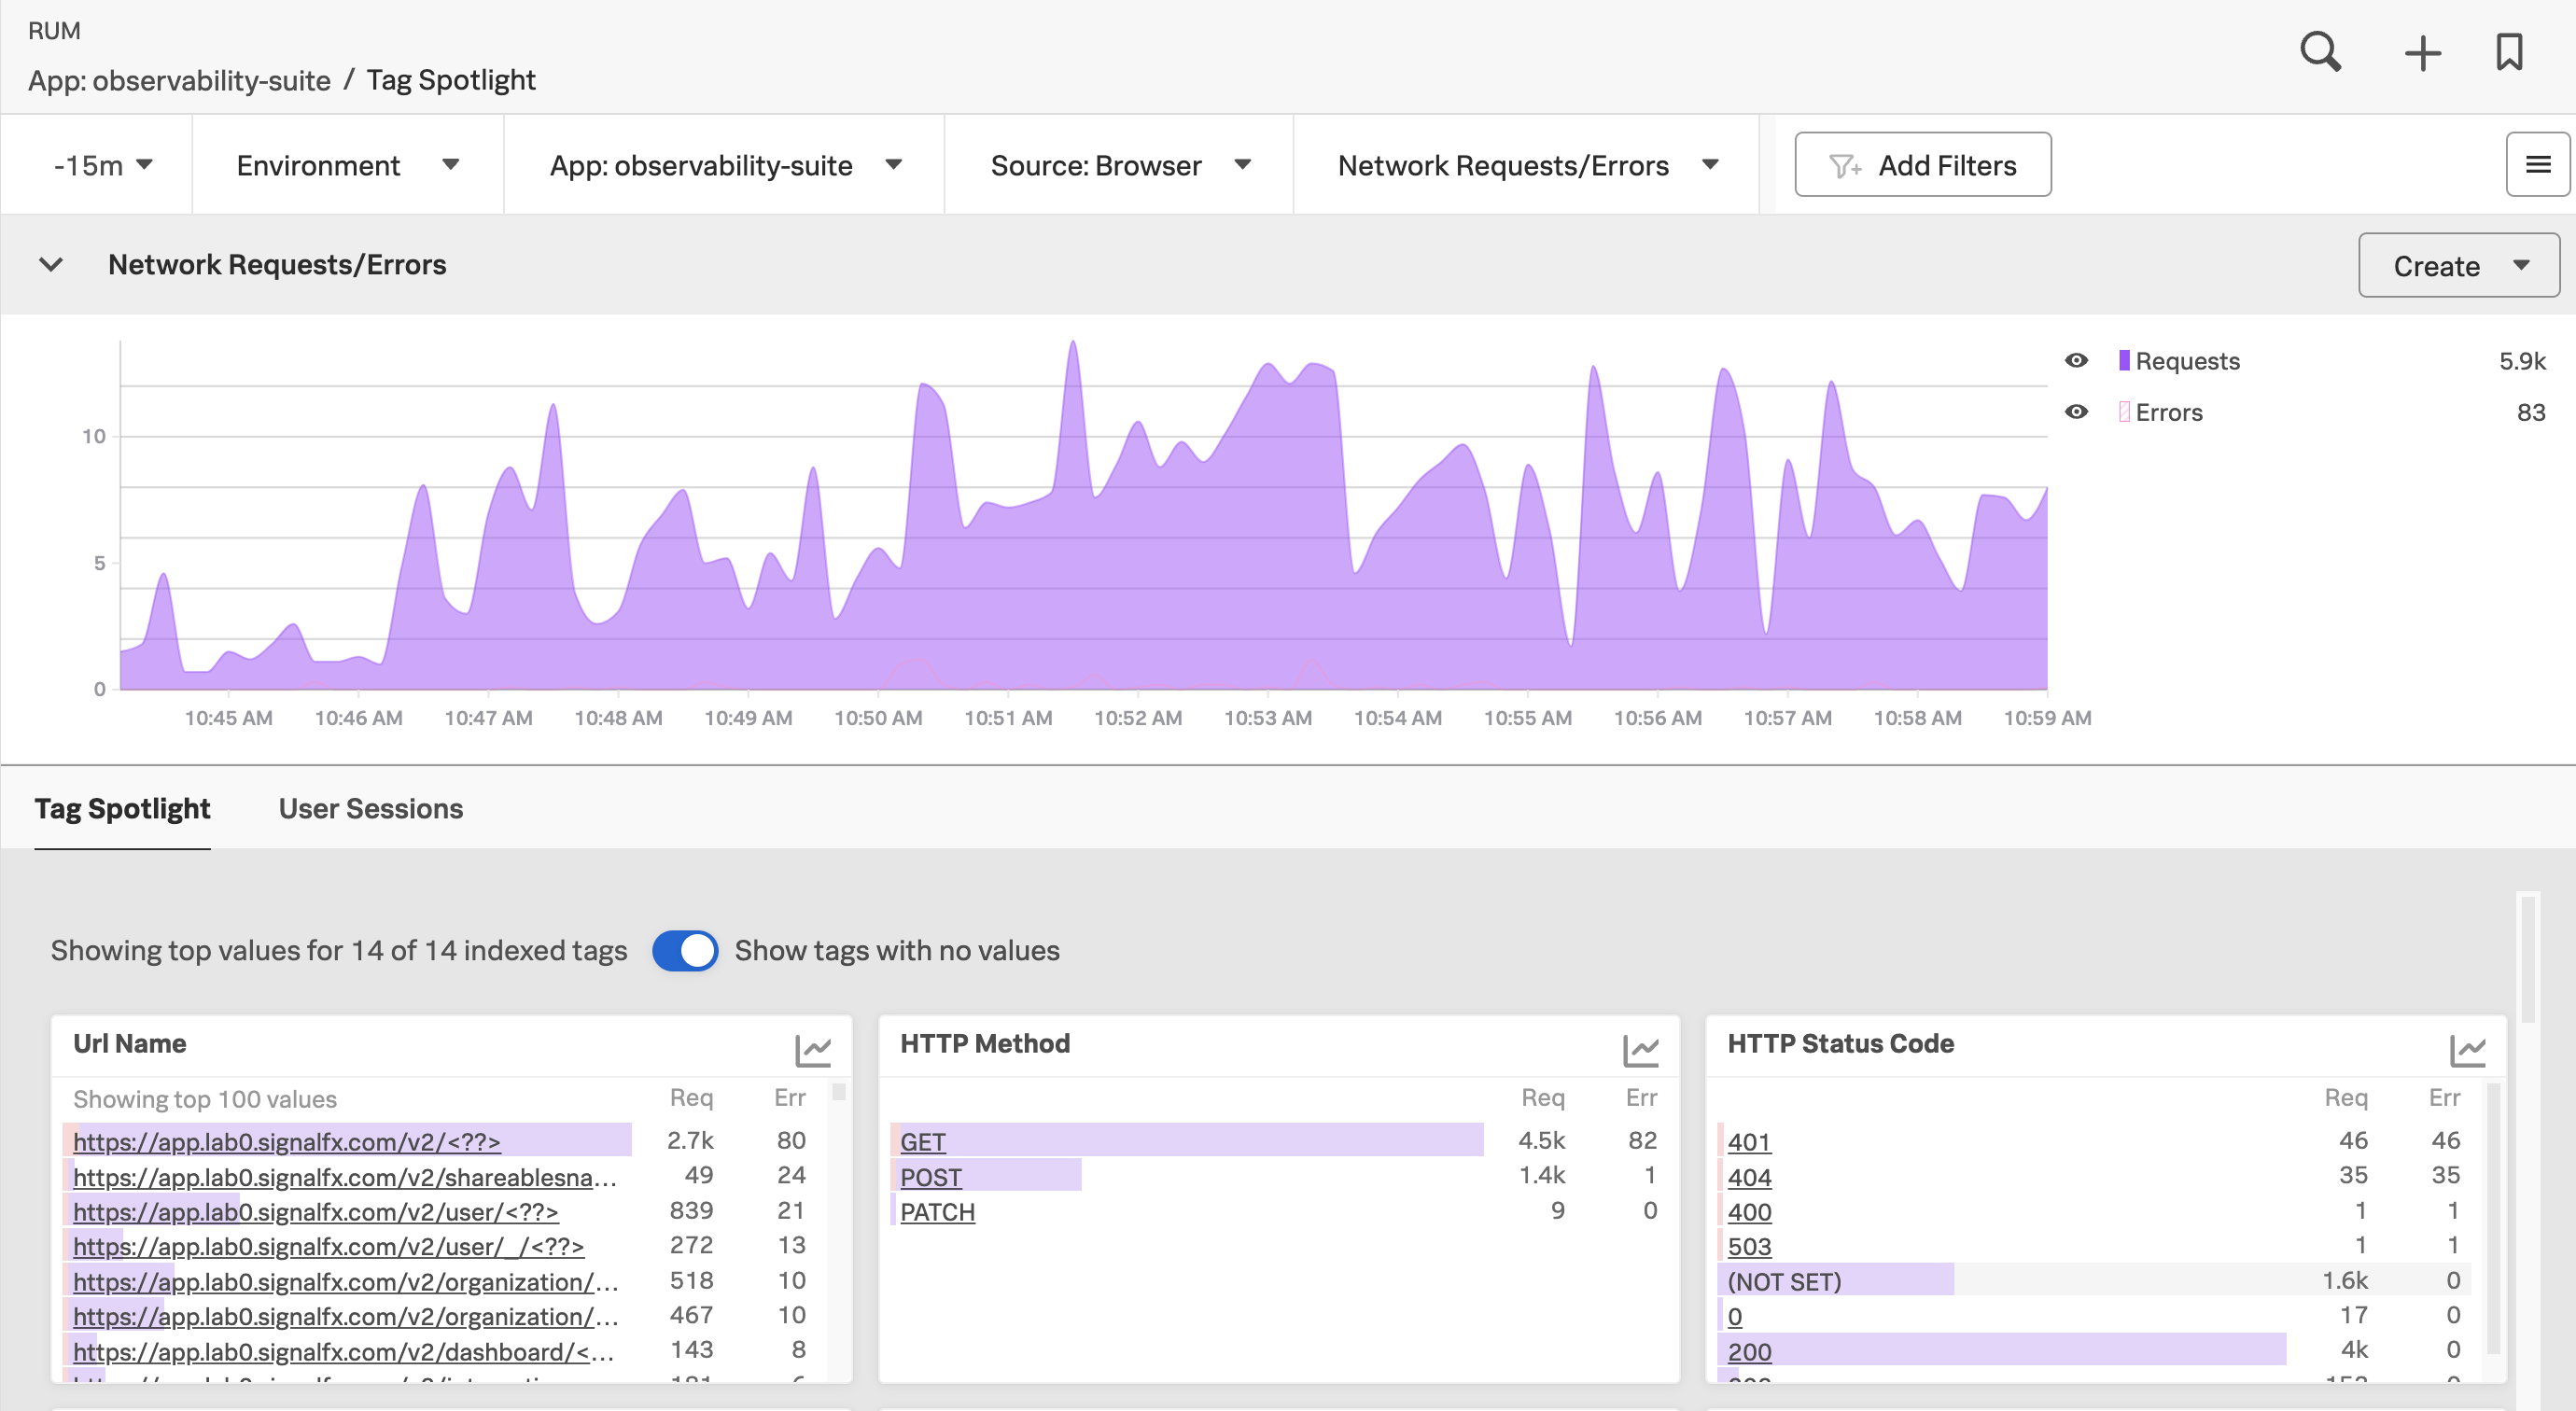
Splunk RUM shows signals from the perspective of what your users experience in the UI. In the following example, a RUM dashboard in the Tag Spotlight view starts with a chart displaying the total count of network requests and errors over a 15-minute period. The following charts display the count of requests and errors by URL name, HTTP method, and HTTP status code.
To learn more about what you can do with RUM, see Introduction to Splunk RUM. Scenarios for monitoring applications and services using Splunk RUM has multiple examples of how you can use RUM.
Splunk Synthetic Monitoring 🔗
Test your SLOs before users do with Splunk Synthetic Monitoring. When you proactively monitor the performance of your web application, you can remediate problems before they impact your users. Technical and business teams use Synthetic Monitoring to create detailed tests that monitor the speed and reliability of websites, web apps, and resources over time, at any stage in the development cycle. See Introduction to Splunk Synthetic Monitoring to learn what you can do with Synthetics Monitoring.
To learn more about when to use Synthetic Monitoring in a scenario, see Scenario: Monitor the performance of a user-facing application.
Alerting on synthetic testing makes Synthetic Monitoring actionable for your development and dev ops teams. Set up browser tests and uptime tests to monitor your site or application at the frequency you prefer. Each test captures a set of metrics each time it runs. To set up alerts that notify you when tests fail, see Detectors and alerts.